Visualize Kinship Matrix as a Heatmap
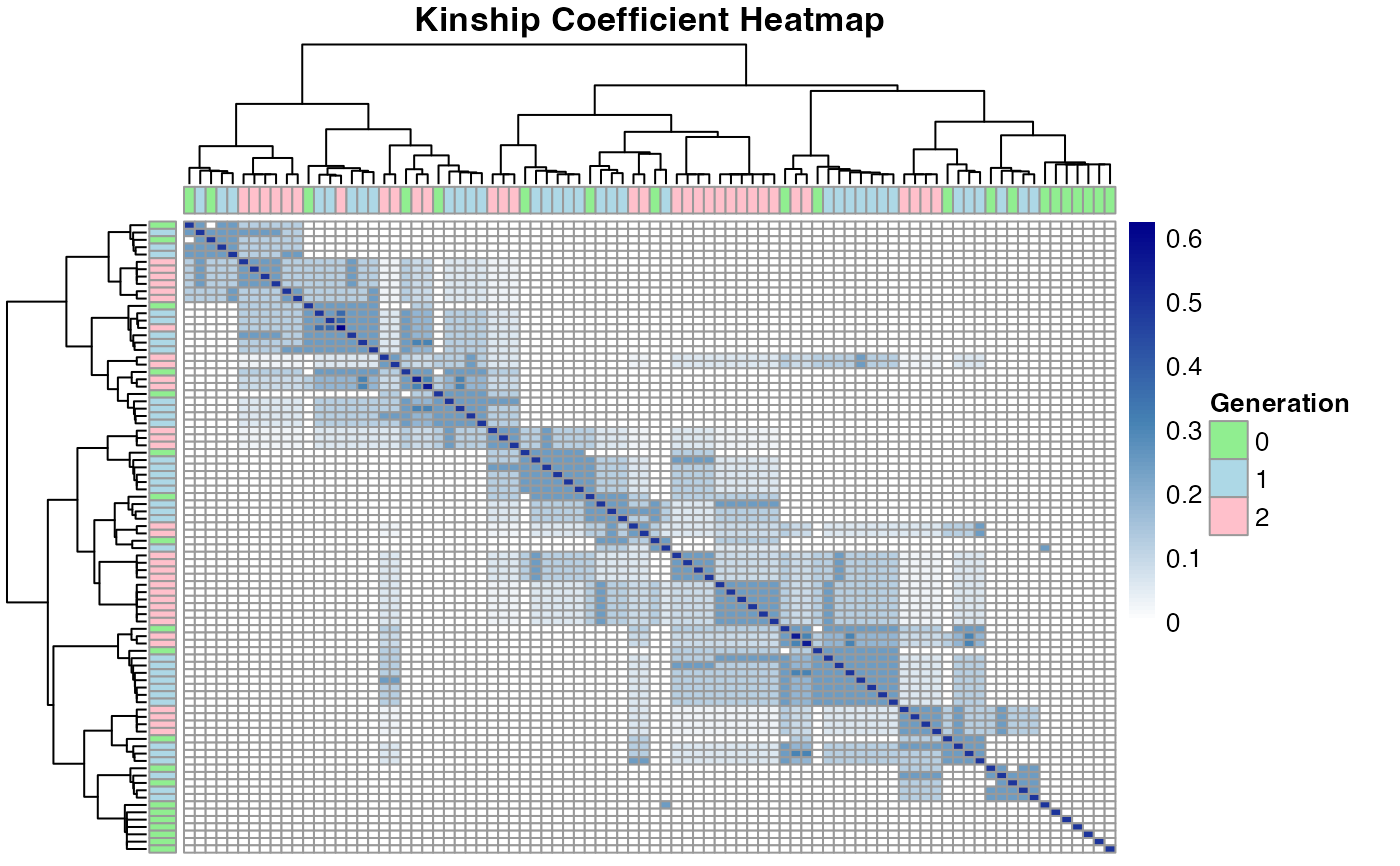
plot_kinship.RdCreates a heatmap visualization of a kinship matrix using the pheatmap package. The function includes generation annotations and limits the visualization to a maximum of 100 individuals for clarity and performance.
plot_kinship(
  kinship_matrix,
  pedigree,
  max_size = 100,
  cluster = TRUE,
  colors = NULL,
  gen_colors = NULL
)
Arguments
- kinship_matrix
A numeric matrix of kinship coefficients.
- pedigree
A data frame containing at least 'id' and 'generation' columns, matching the individuals in the kinship matrix.
- max_size
Integer. Maximum number of individuals to visualize. Default is 100.
- cluster
Logical. Whether to perform hierarchical clustering. Default is TRUE.
- colors
Character vector of colors for the heatmap. If NULL, uses a white to dark blue gradient.
- gen_colors
Named vector of colors for generations. If NULL, uses default colors.
Value
A pheatmap object invisibly.
Details
If the kinship matrix contains more individuals than max_size, the function will randomly sample max_size individuals for visualization. The generation information is shown as a color bar annotation.
Examples
# Simulate a pedigree
ped <- simulate_pedigree(n_founders = 20, n_generations = 2)

# Calculate kinship
kinship <- calculate_kinship(ped)

# Visualize
plot_kinship(kinship, ped)