Background
\[
X = \beta_{gx} G + \beta_{cx} C + \epsilon_x
\]
\[
Y = \beta_{xy} X + \beta_{cy} C + \epsilon_y
\]
Two stage least squares aims to estimate the causal effect of X on Y, \(\beta_{xy}\) , by using G as an instrument for X. The first stage regression is:
\[
X = \beta_{gx} G
\]
Make a prediction of X from G, and then use this predicted value of X in the second stage regression to estimate \(\beta_{xy}\) .
\[
\hat{X} = \hat{\beta}_{gx} G
\]
And then the second stage regression is:
\[
Y = \beta_{xy} \hat{X} + error
\]
So \(\hat{\beta_{xy}}\) is the estimate of the causal effect of X on Y, which is independent of the common confounding of X and Y.
Simulation
Generate Height:
set.seed (123 )library (dplyr)
Attaching package: 'dplyr'
The following objects are masked from 'package:stats':

    filter, lag
The following objects are masked from 'package:base':

    intersect, setdiff, setequal, union
library (ggplot2)library (furrr)
Loading required package: future
library (knitr)<- 1000000 <- 0.7 <- 0.75 <- rnorm (n, mean = 0 , sd = sqrt (r2_prs * h2))<- rnorm (n, mean = 0 , sd = sqrt ((1 - r2_prs) * h2))<- rnorm (n, mean = 0 , sd = sqrt (1 - h2))<- prs_explained + prs_unexplained + childhood_environment<- height - prs_explained
Generate coronary heart disease (just a continuous measure for simplicity):
<- - 0.1 <- - 0.2 <- beta_height_chd * height + beta_environment_chd * childhood_environment + rnorm (n)
Get estimates of the effect of PRS, height and residual height on CHD:
<- function (x, y) {<- summary (lm (y ~ x))$ coefficientstibble (beta = mod[2 , 1 ],se = mod[2 , 2 ],p = mod[2 , 4 ],rsq = cor (x, y)^ 2 ,var_exposure = var (x)bind_rows (get_est (prs_explained, chd) %>% mutate (exposure = "PRS" ),get_est (height, chd) %>% mutate (exposure = "Height" ),get_est (residual_height, chd) %>% mutate (exposure = "Residual Height" )%>% kable ()
-0.1009233
0.0014010
0
0.0051627
0.5249234
PRS
-0.1614507
0.0010052
0
0.0251495
0.9992023
Height
-0.2279945
0.0014585
0
0.0238522
0.4752085
Residual Height
Generalise this simulation to a function:
<- function (h2, r2_prs, beta_height_chd, beta_environment_chd, n = 100000 , simrep = 1 ) {<- list (h2 = h2,r2_prs = r2_prs,beta_height_chd = beta_height_chd,beta_environment_chd = beta_environment_chd,n = n,simrep = simrep<- rnorm (n, mean = 0 , sd = sqrt (r2_prs * h2))<- rnorm (n, mean = 0 , sd = sqrt ((1 - r2_prs) * h2))<- rnorm (n, mean = 0 , sd = sqrt (1 - h2))<- prs_explained + prs_unexplained + childhood_environment<- height - prs_explained<- beta_height_chd * height + beta_environment_chd * childhood_environment + rnorm (n)<- bind_rows (get_est (prs_explained, chd) %>% mutate (exposure = "PRS" ),get_est (height, chd) %>% mutate (exposure = "Height" ),get_est (residual_height, chd) %>% mutate (exposure = "Residual Height" )bind_cols (args, res)sim (h2 = 0.7 , r2_prs = 0.75 , beta_height_chd = - 0.1 , beta_environment_chd = - 0.1 ) %>% kable ()
0.7
0.75
-0.1
-0.1
1e+05
1
-0.1142055
0.0043857
0
0.0067356
0.5240976
PRS
0.7
0.75
-0.1
-0.1
1e+05
1
-0.1353018
0.0031543
0
0.0180668
1.0015774
Height
0.7
0.75
-0.1
-0.1
1e+05
1
-0.1581388
0.0045785
0
0.0117895
0.4784431
Residual Height
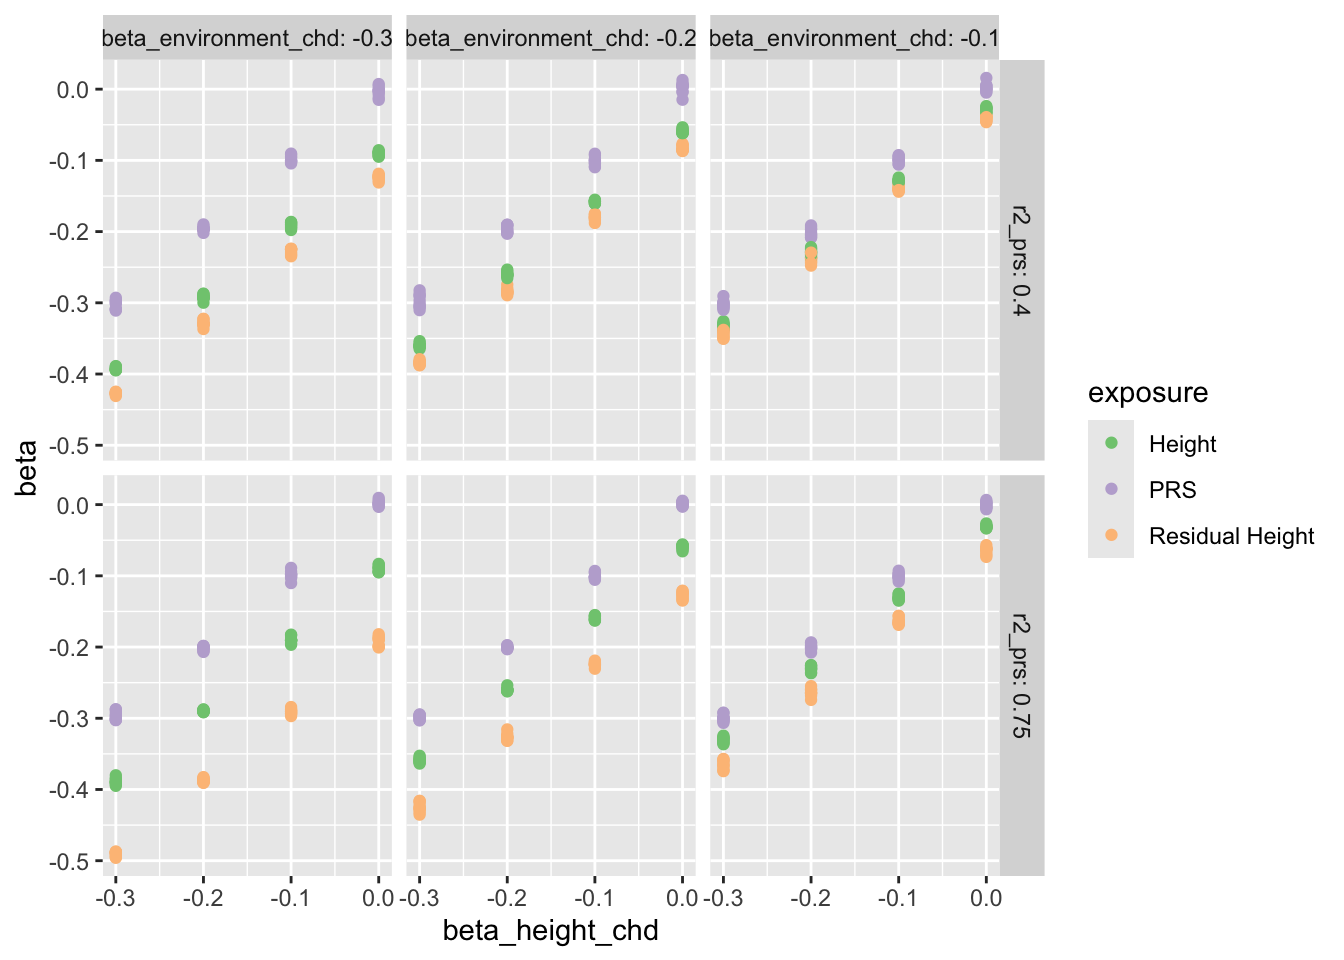
Try a few different scenarios
<- expand.grid (h2 = 0.7 ,r2_prs = c (0.75 , 0.4 ),beta_height_chd = c (0 , - 0.1 , - 0.2 , - 0.3 ),beta_environment_chd = c (- 0.1 , - 0.2 , - 0.3 ),simrep = 1 : 10 plan (multicore)<- future_pmap (params, sim, .progress = TRUE ) %>% bind_rows ()
look at the results:
ggplot (results, aes (x = beta_height_chd, y = beta, colour = exposure)) + geom_point () + facet_grid (r2_prs ~ beta_environment_chd, labeller = label_both) + scale_colour_brewer (type= "qual" )
R version 4.5.2 (2025-10-31)
Platform: aarch64-apple-darwin20
Running under: macOS Sequoia 15.2

Matrix products: default
BLAS:   /System/Library/Frameworks/Accelerate.framework/Versions/A/Frameworks/vecLib.framework/Versions/A/libBLAS.dylib
LAPACK: /Library/Frameworks/R.framework/Versions/4.5-arm64/Resources/lib/libRlapack.dylib;  LAPACK version 3.12.1

locale:
[1] en_US.UTF-8/en_US.UTF-8/en_US.UTF-8/C/en_US.UTF-8/en_US.UTF-8

time zone: Europe/London
tzcode source: internal

attached base packages:
[1] stats     graphics  grDevices utils     datasets  methods   base

other attached packages:
[1] knitr_1.50    furrr_0.3.1   future_1.69.0 ggplot2_4.0.1 dplyr_1.1.4

loaded via a namespace (and not attached):
 [1] gtable_0.3.6       jsonlite_2.0.0     compiler_4.5.2     tidyselect_1.2.1
 [5] parallel_4.5.2     globals_0.19.0     scales_1.4.0       yaml_2.3.11
 [9] fastmap_1.2.0      R6_2.6.1           labeling_0.4.3     generics_0.1.4
[13] htmlwidgets_1.6.4  tibble_3.3.0       pillar_1.11.1      RColorBrewer_1.1-3
[17] rlang_1.1.6        xfun_0.54          S7_0.2.1           cli_3.6.5
[21] withr_3.0.2        magrittr_2.0.4     digest_0.6.39      grid_4.5.2
[25] lifecycle_1.0.4    vctrs_0.6.5        evaluate_1.0.5     glue_1.8.0
[29] farver_2.1.2       listenv_0.10.0     codetools_0.2-20   parallelly_1.46.1
[33] rmarkdown_2.30     purrr_1.2.0        tools_4.5.2        pkgconfig_2.0.3
[37] htmltools_0.5.8.1