Background
library (qtl2)library (ggplot2)library (dplyr)
Attaching package: 'dplyr'
The following objects are masked from 'package:stats':

    filter, lag
The following objects are masked from 'package:base':

    intersect, setdiff, setequal, union
Download the data and read in
<- "https://raw.githubusercontent.com/rqtl/qtl2data/main/DOex/DOex.zip" <- read_cross2 (file)
Calculate genotype and allele probabilities
<- calc_genoprob (DOex, error_prob= 0.002 )<- genoprob_to_alleleprob (pr)
Calculate kinships
<- calc_kinship (apr, "loco" )
Organise covariates
<- (DOex$ covar$ Sex == "male" )* 1 names (sex) <- rownames (DOex$ covar)<- setNames ( (DOex$ covar$ Sex == "male" )* 1 , rownames (DOex$ covar) )
Perform scan
<- scan1 (apr, DOex$ pheno, k, sex)par (mar= c (4.1 , 4.1 , 0.6 , 0.6 ))plot (out, DOex$ gmap)
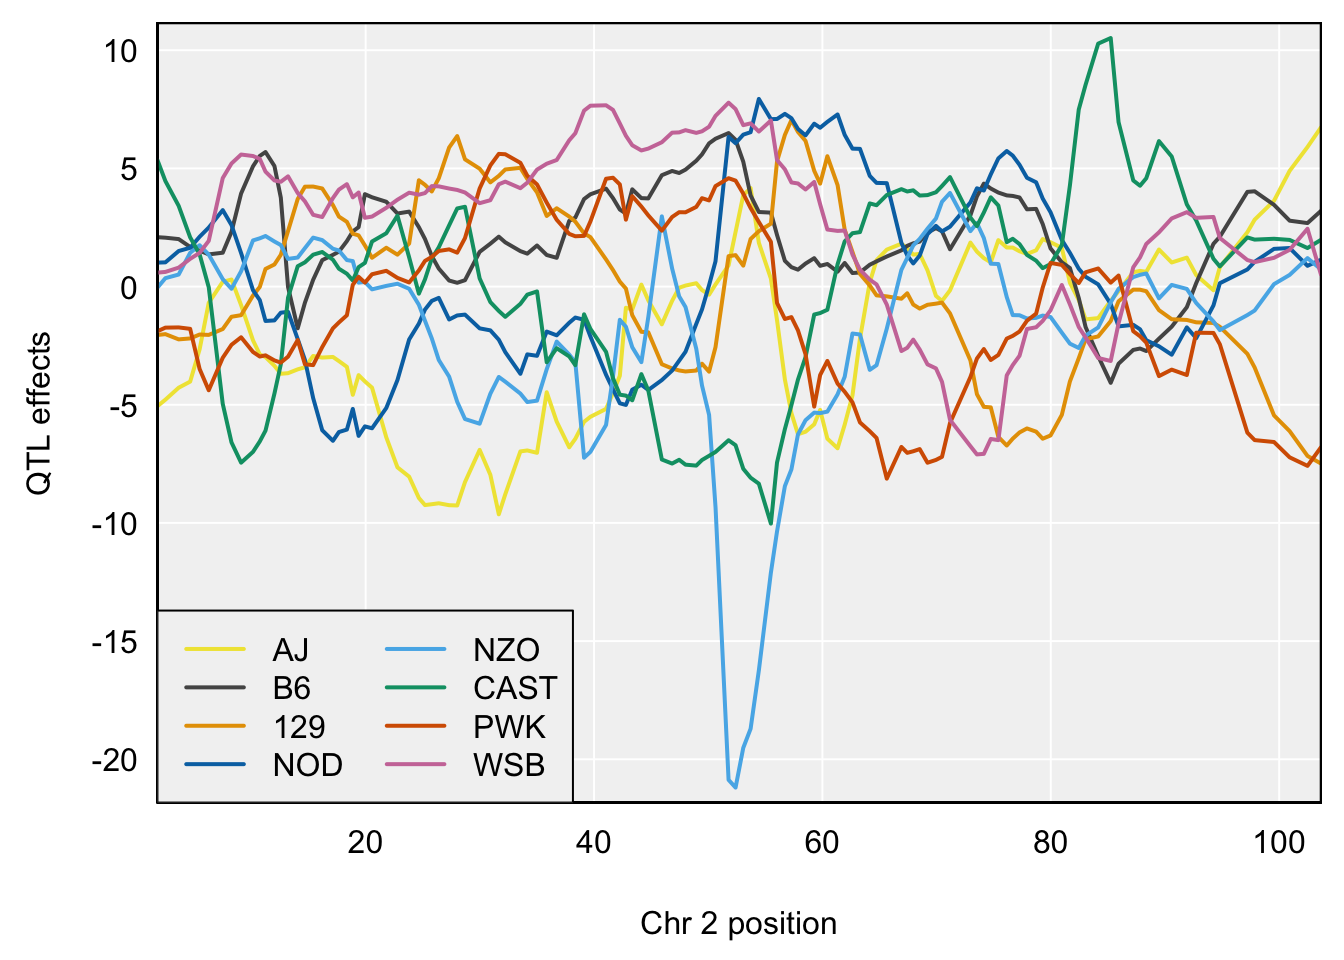
Get coefficients for each marker on chromosome 2. This gives an additive effect for each founder line.
<- scan1coef (apr[,"2" ], DOex$ pheno, k[["2" ]], sex, se= TRUE )par (mar= c (4.1 , 4.1 , 0.6 , 0.6 ))plot_coefCC (coef_c2, DOex$ gmap["2" ], bgcolor= "gray95" , legend= "bottomleft" )
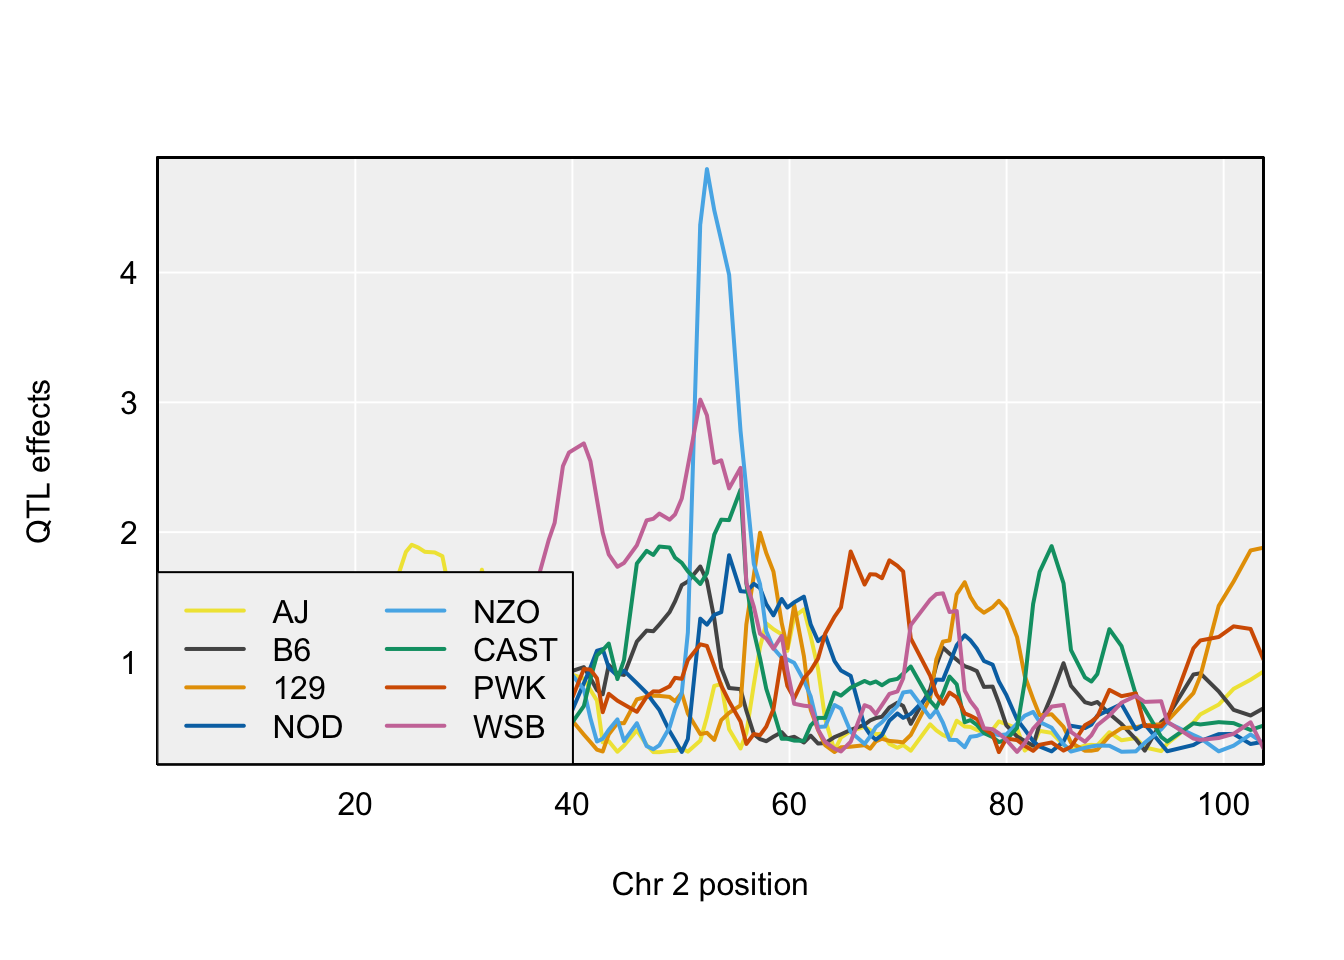
We can also get p-values for each founder line:
<- coef_c2 / attributes (coef_c2)$ SE<- pnorm (abs (z), low= F)plot_coefCC (- log10 (pval), DOex$ gmap["2" ], bgcolor= "gray95" , legend= "bottomleft" )
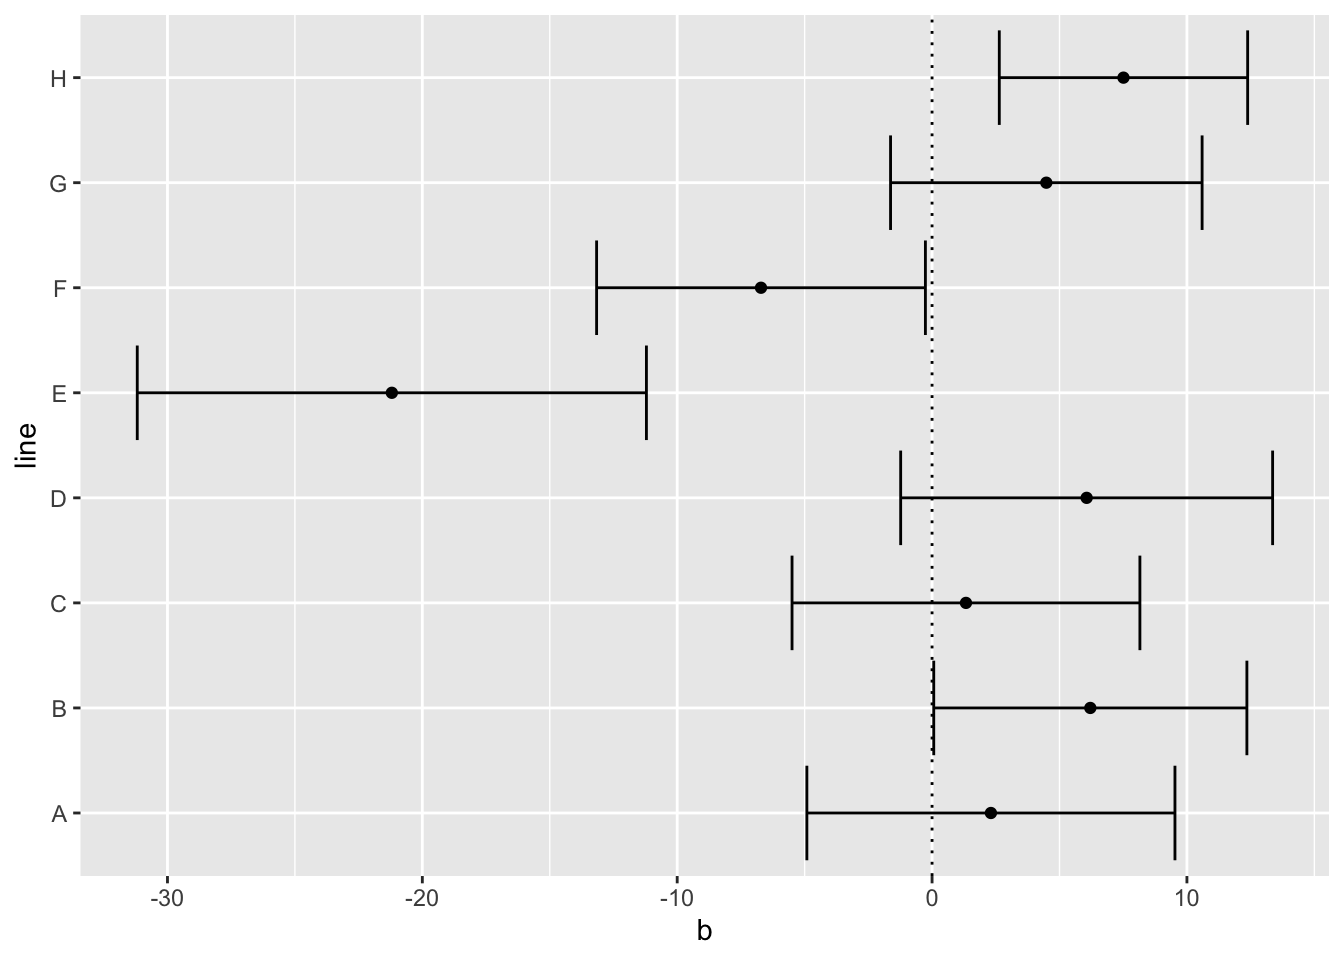
Make a forest plot of the effect sizes at the peak:
<- which (abs (coef_c2[,1 : 8 ]) == max (abs (coef_c2[,1 : 8 ])), arr.ind= TRUE )[1 ]<- tibble (line = colnames (coef_c2)[1 : 8 ],b= coef_c2[marker_position,1 : 8 ], se = attributes (coef_c2)$ SE[marker_position,1 : 8 ],lci = b - 1.96 * se,uci = b + 1.96 * seggplot (best_coef, aes (x= b, y= line)) + geom_point () + geom_errorbarh (aes (xmin= lci, xmax= uci)) + geom_vline (linetype= "dotted" , xintercept= 0 )
There is clear heterogeneity in effect sizes across the lines, so the average effect would be diluted. This heterogeneity could be because the marker is in LD with the causal variant in one line but not the others?
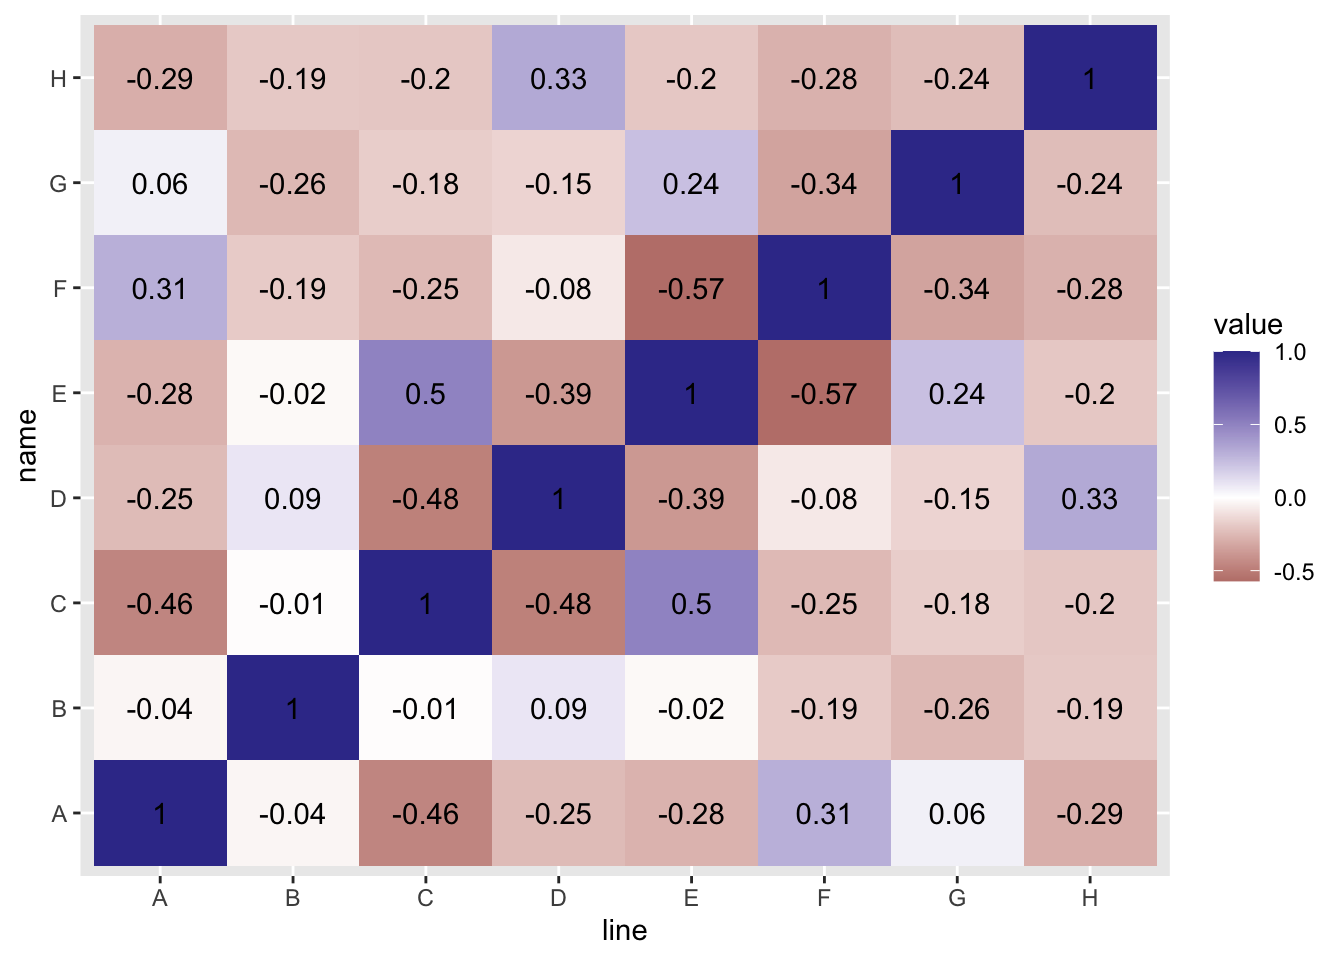
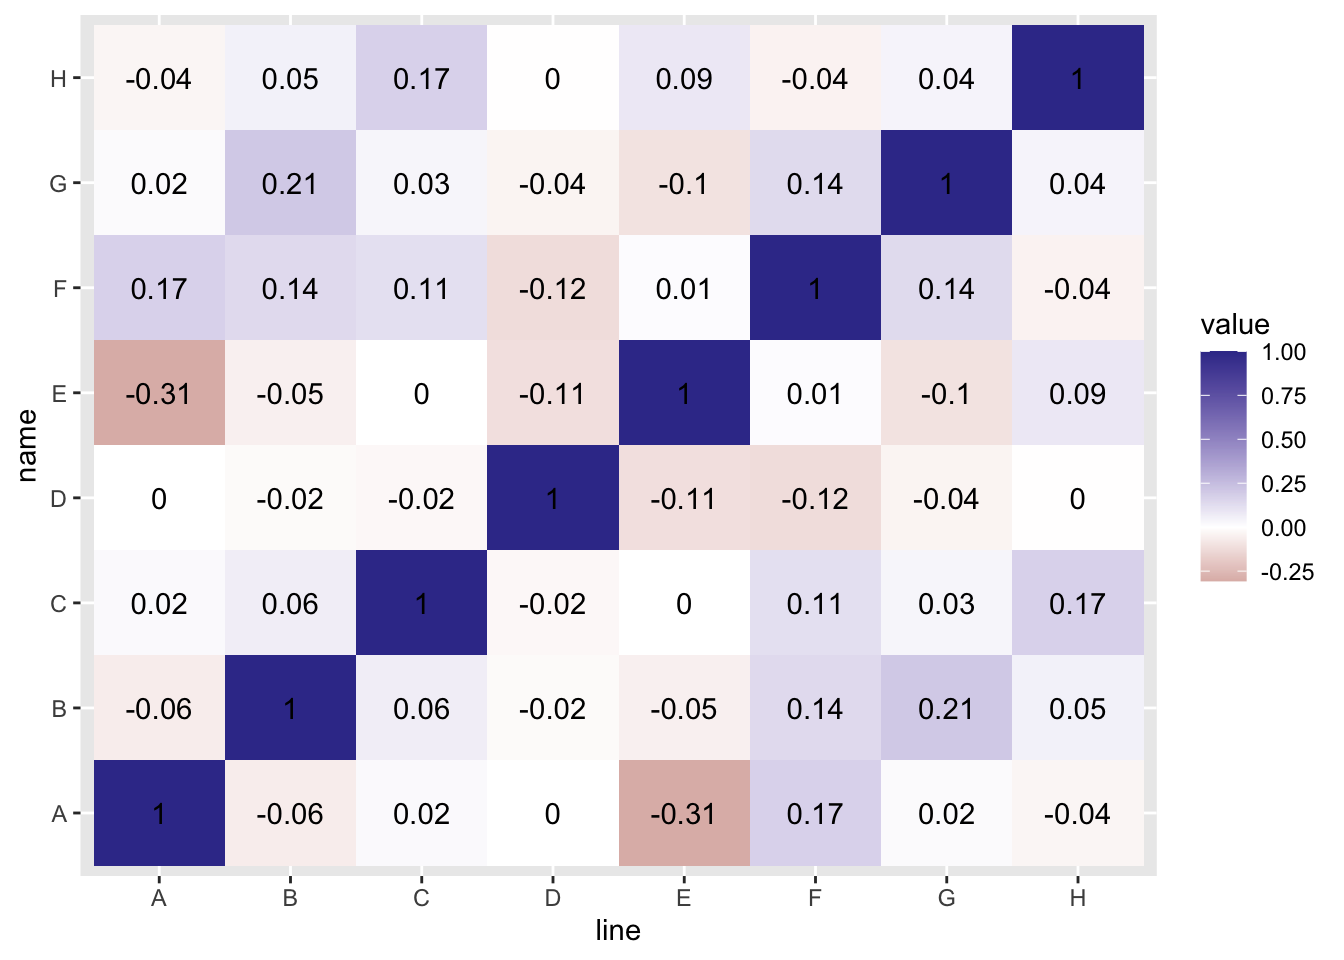
To what degree are these effects correlated at null positions?
<- which (out < 2 )<- lapply (names (apr), \(x) {scan1coef (apr[,x], DOex$ pheno, k[[x]], sex, se= TRUE )<- do.call (rbind, coefs)[null_positions,1 : 8 ]cor (coefs) %>% as_tibble () %>% mutate (line = LETTERS[1 : 8 ]) %>% :: pivot_longer (! line) %>% ggplot (., aes (x= line, y= name)) + geom_tile (aes (fill= value)) + scale_fill_gradient2 () + geom_text (aes (label= round (value, 2 )))
Try permuting for comparison
<- coefsfor (i in 1 : ncol (coefs_permuted)) {<- sample (coefs_permuted[,i])cor (coefs_permuted) %>% as_tibble () %>% mutate (line = LETTERS[1 : 8 ]) %>% :: pivot_longer (! line) %>% ggplot (., aes (x= line, y= name)) + geom_tile (aes (fill= value)) + scale_fill_gradient2 () + geom_text (aes (label= round (value, 2 )))
Questions
How would you obtain an average additive effect estimate across all lines?
R version 4.5.1 (2025-06-13)
Platform: aarch64-apple-darwin20
Running under: macOS Sonoma 14.6.1

Matrix products: default
BLAS:   /Library/Frameworks/R.framework/Versions/4.5-arm64/Resources/lib/libRblas.0.dylib
LAPACK: /Library/Frameworks/R.framework/Versions/4.5-arm64/Resources/lib/libRlapack.dylib;  LAPACK version 3.12.1

locale:
[1] en_US.UTF-8/en_US.UTF-8/en_US.UTF-8/C/en_US.UTF-8/en_US.UTF-8

time zone: Europe/London
tzcode source: internal

attached base packages:
[1] stats     graphics  grDevices utils     datasets  methods   base

other attached packages:
[1] tidyr_1.3.1   dplyr_1.1.4   ggplot2_3.5.2 qtl2_0.38

loaded via a namespace (and not attached):
 [1] bit_4.6.0          gtable_0.3.6       jsonlite_2.0.0     compiler_4.5.1
 [5] tidyselect_1.2.1   Rcpp_1.1.0         blob_1.2.4         parallel_4.5.1
 [9] scales_1.4.0       yaml_2.3.10        fastmap_1.2.0      R6_2.6.1
[13] labeling_0.4.3     generics_0.1.4     knitr_1.50         htmlwidgets_1.6.4
[17] tibble_3.3.0       DBI_1.2.3          pillar_1.11.0      RColorBrewer_1.1-3
[21] rlang_1.1.6        cachem_1.1.0       xfun_0.52          bit64_4.6.0-1
[25] RSQLite_2.3.11     memoise_2.0.1      cli_3.6.5          withr_3.0.2
[29] magrittr_2.0.3     digest_0.6.37      grid_4.5.1         lifecycle_1.0.4
[33] vctrs_0.6.5        evaluate_1.0.4     glue_1.8.0         data.table_1.17.8
[37] farver_2.1.2       rmarkdown_2.29     purrr_1.1.0        tools_4.5.1
[41] pkgconfig_2.0.3    htmltools_0.5.8.1