library(ggplot2)
G_from_df <- function(df) {
stopifnot(inherits(df, "data.frame"))
stopifnot(nrow(df) >0)
stopifnot(all(c("i", "j", "eff") %in% names(df)))
nodes <- unique(c(df$i, df$j))
message(nrow(df), " causal relationships specified amongst ", length(nodes), " traits")
G <- matrix(0, length(nodes), length(nodes))
rownames(G) <- nodes
colnames(G) <- nodes
for(x in 1:nrow(df)) {
G[df$i[x], df$j[x]] <- df$eff[x]
}
return(G)
}
#' @param latent_causal_matrix For L latent traits, the causal relationships between them. Should be a DAG
#' @param pleio_min Mimumum fraction of h2 due to pleiotropy. How deviant should proximal traits be to the underlying latent trait? Proximal traits will have the same h2 as the latent trait, but some fraction of that h2 will be from other variants.
#' @param pleio_max Maximum fraction of h2 due to pleiotropy
#' @param n_proximal_traits Vector of length L saying how many traits for each latent trait
#' @param nid Vector of size sum(n_proximal_traits). Sample size of each proximal trait
#' @param nsnp Vector of size L saying how many SNPs for each latent trait
#' @param h2 Vector of size L saying variance explained in proximal trait by SNPs
pie_hat_sim <- function(latent_causal_matrix, pleio_min, pleio_max, n_proximal_traits, nid, nsnp, h2) {
n_latent <- nrow(latent_causal_matrix)
a <- lapply(1:n_latent, \(trait) {
latent_names <- unique(c(latent_causal_matrix$i, latent_causal_matrix$j))
tibble(
i = latent_names[trait],
j = paste0(latent_names[trait], 1:n_proximal_traits[trait]),
eff=runif(n_proximal_traits[trait], 1-pleio_max, 1-pleio_min),
pi = 0.1,
h2 = h2[trait]
)
}) %>% bind_rows()
J <- sum(nsnp)
latent_causal_matrix$pi <- nsnp / J
latent_causal_matrix$h2 <- h2
mat <- G_from_df(bind_rows(latent_causal_matrix, a))
o <- sim_mv(
G = mat,
N = c(rep(500000, n_latent), nid),
J = sum(nsnp),
h2 = c(latent_causal_matrix$h2, a$h2),
pi = c(latent_causal_matrix$pi, a$pi),
est_s = TRUE,
af = function(n) {runif(n, 0.01, 0.99)}
)
dat <- lapply(1:ncol(o$beta_hat), \(i) {
as_tibble(o$snp_info) %>%
mutate(
trait = colnames(o$direct_trait_effects)[i],
bhat = o$beta_hat[,i],
se = o$se_beta_hat[,i],
pval = pnorm(abs(bhat)/se, low=F)
)
}) %>% bind_rows()
return(dat)
}
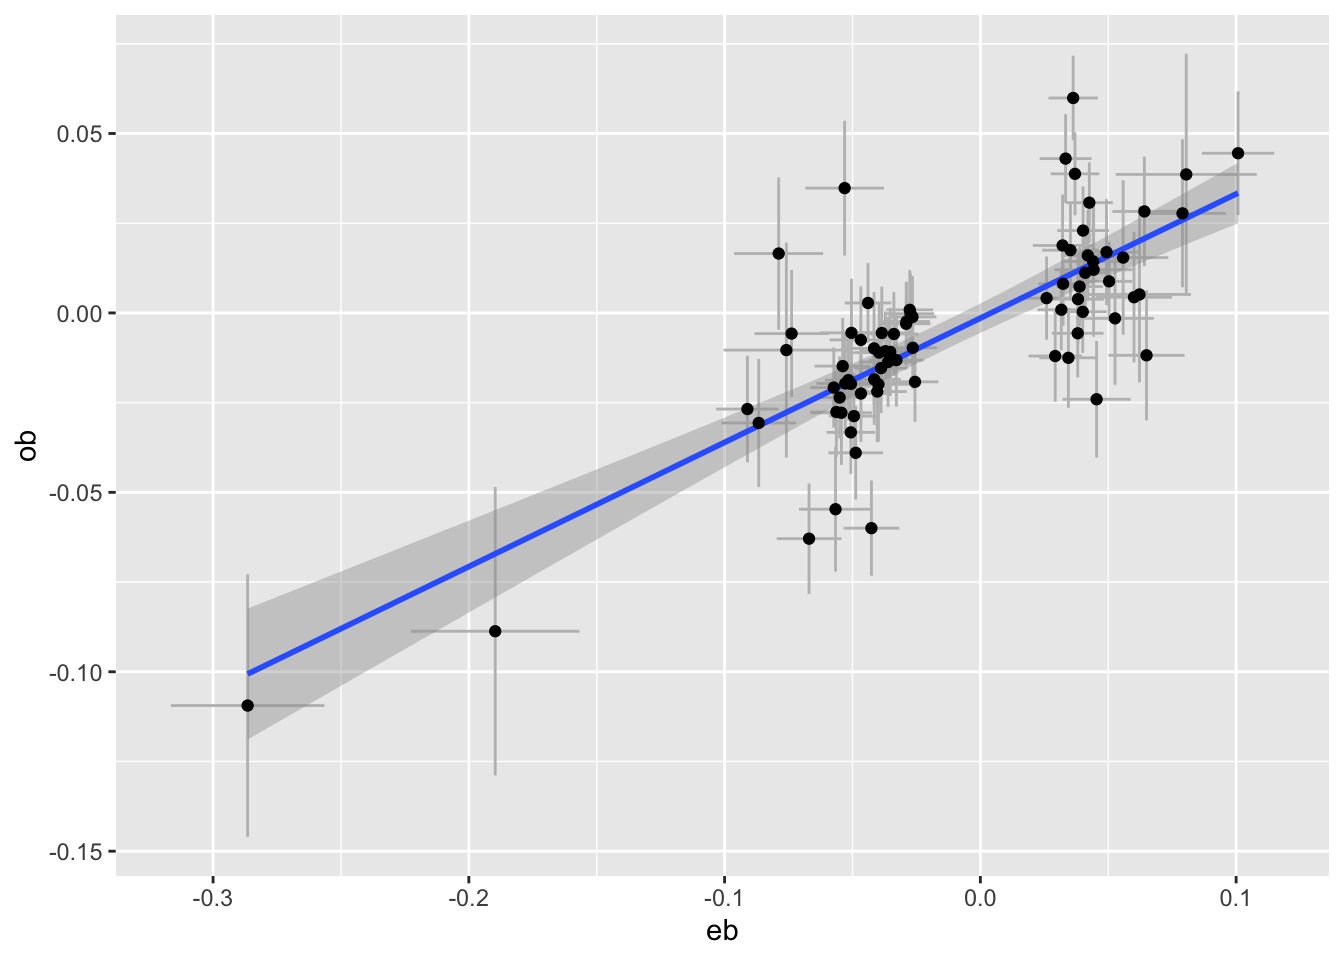
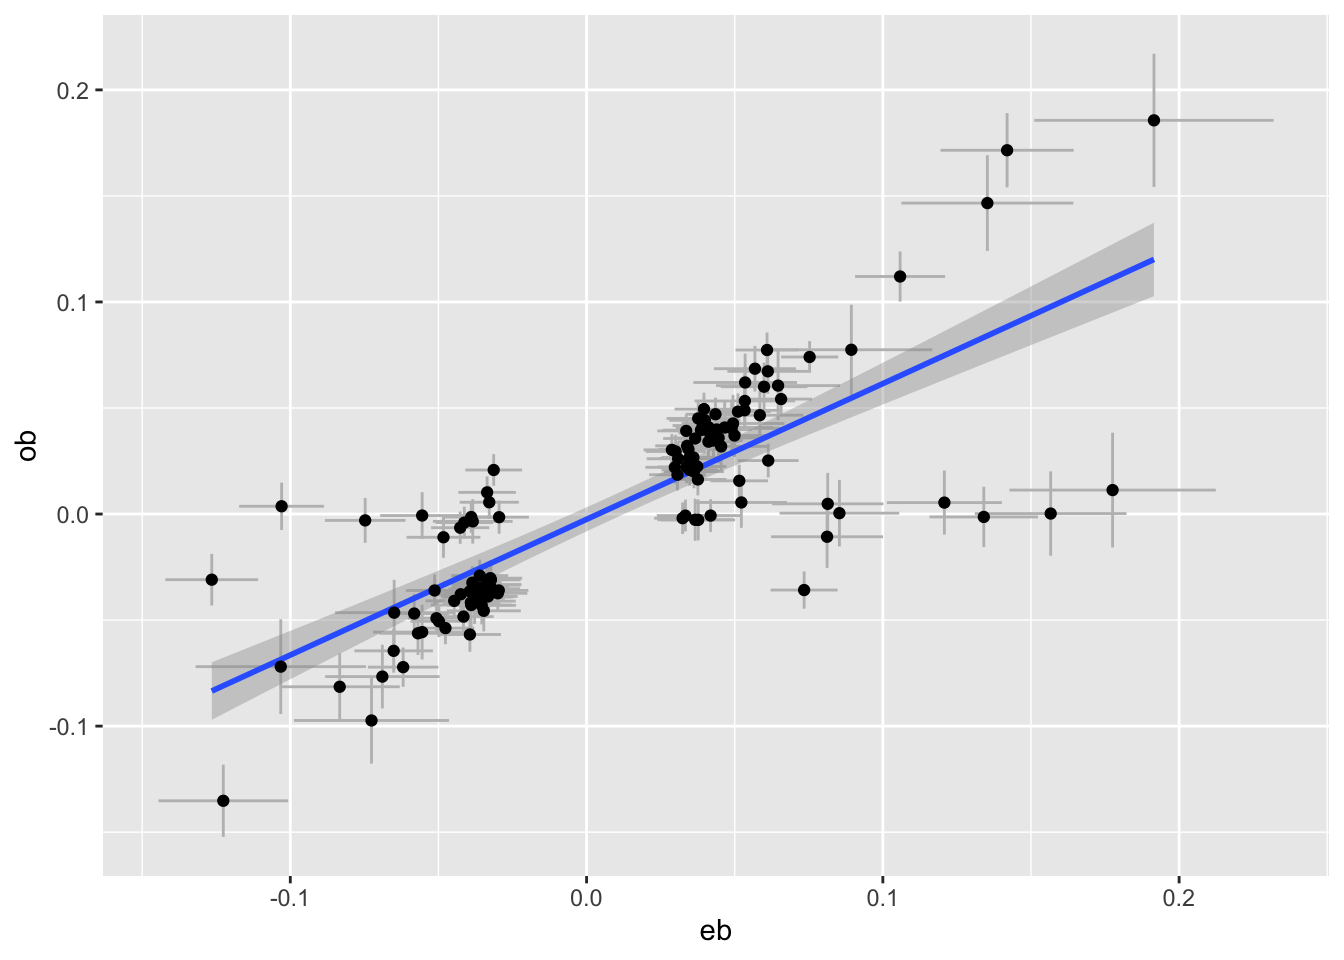
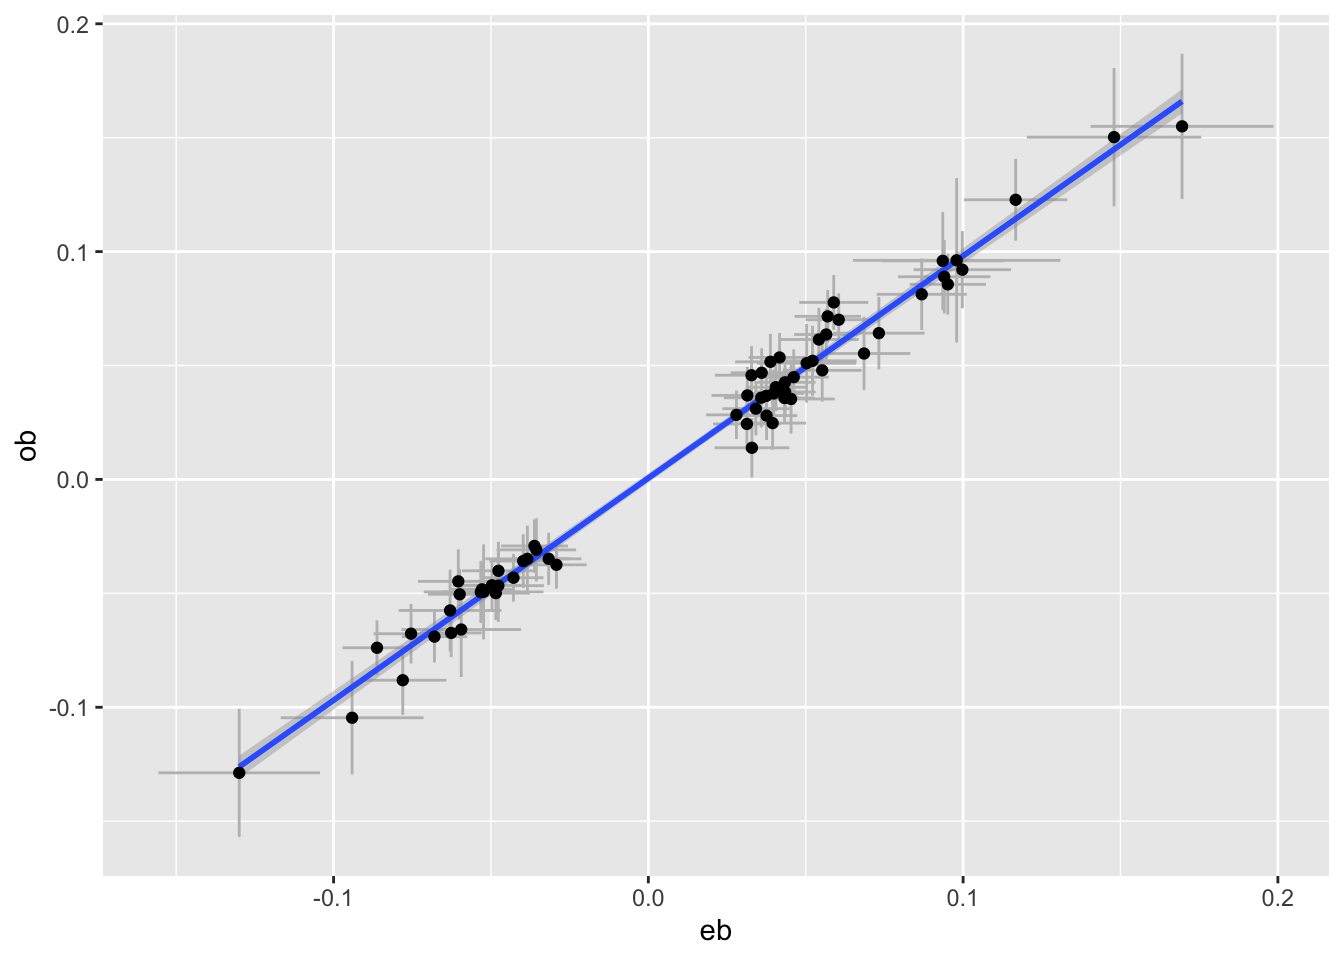
plot_pair <- function(dats, exposure, outcome) {
e <- subset(dats, pval < 5e-8 & trait == exposure)
o <- subset(dats, SNP %in% e$SNP & trait == outcome)
tibble(eb=e$bhat, ese=e$se, ob=o$bhat, ose=o$se) %>%
ggplot(aes(x=eb, y=ob)) +
geom_errorbar(aes(ymin=ob - ose * 1.96, ymax=ob+ose*1.96), colour="grey") +
geom_errorbarh(aes(xmin=eb - ese * 1.96, xmax=eb+ese*1.96), colour="grey") +
geom_smooth(method="lm") +
geom_point()
}