library(ggplot2)
calculate_power <- function(b_baseline, n_baseline, b_alternative, n_alternative) {
# Calculate the standard error of the baseline effect
se_baseline <- 1 / sqrt(n_baseline)
# Calculate the standard error of the alternative effect
se_alternative <- 1 / sqrt(n_alternative)
# Calculate the non-central chi-square statistic
qe <- metafor::rma.uni(
c(b_baseline, b_alternative),
sei=c(se_baseline, se_alternative),
method="FE"
)$QE
# Calculate the power using the non-central chi-square distribution with 1 df
power <- pchisq(qchisq(0.05, df = 1, lower.tail = FALSE), df = 1, ncp = qe, lower.tail = FALSE)
return(power)
}
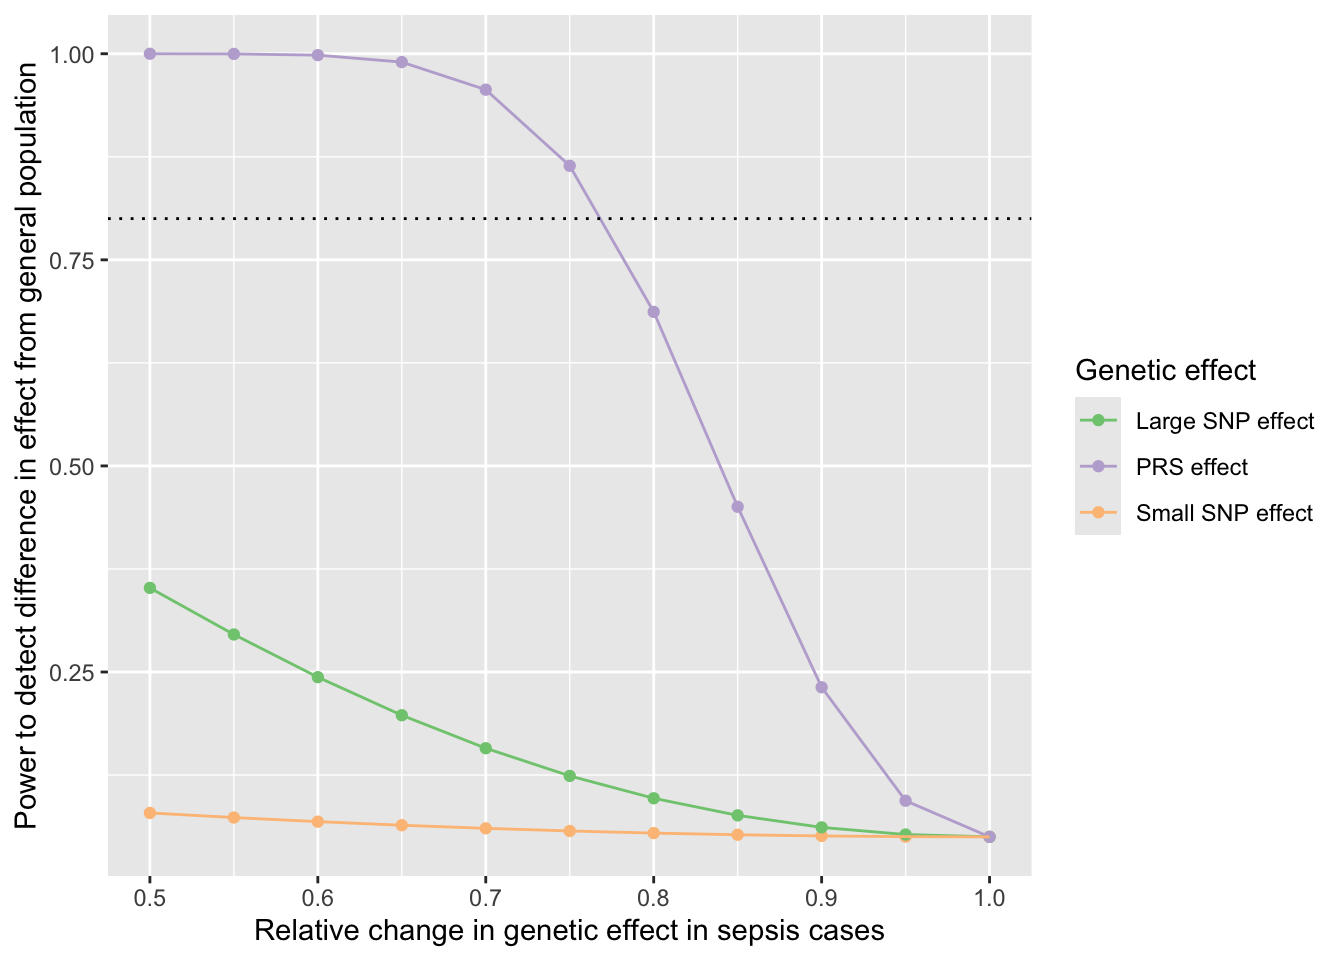
# Set the parameters
param <- expand.grid(
b_baseline = sqrt(c(0.001, 0.01, 0.15)),
n_baseline = 500000,
n_alternative = 1000,
perc_change_range = seq(0.5, 1, by = 0.05),
eff=""
) %>% mutate(
eff=case_when(b_baseline == sqrt(0.001) ~ "Small SNP effect", b_baseline == sqrt(0.01) ~ "Large SNP effect", b_baseline == sqrt(0.15) ~ "PRS effect"),
b_alternative = b_baseline * perc_change_range
)
# Calculate power
for(i in 1:nrow(param)) {
param$power[i] <- calculate_power(param$b_baseline[i], param$n_baseline[i], param$b_alternative[i], param$n_alternative[i])
}
# Plot
ggplot(param, aes(x=perc_change_range, y=power, colour=eff)) +
geom_point() +
geom_line() +
geom_hline(yintercept=0.8, linetype="dotted") +
scale_colour_brewer(type="qual") +
labs(x="Relative change in genetic effect in sepsis cases", y="Power to detect difference in effect from general population", colour="Genetic effect")