Summary imputation returns Z scores, need to convert back to beta and se. Approach
\(se(\beta) = var(y) / \sqrt{2p(1-p)n}\)
= z * se()
Assumes no inbreeding or HW disequilibrium and constant N across SNPs. Assumes collapsability of effects, which is probably ok for small effects in logistic regression studies.
Instead of trying to estimate \(var(y)\) we could just use known betas to obtain a correction factor for imputed values e.g.
Fit a linear model of known betas on imputed betas
Divide imputed betas by coefficient from (1)
Continuous trait example
library(ieugwasr)
OpenGWAS updates:
Date: 2024-05-17
[>] OpenGWAS is growing!
[>] Please take 2 minutes to give us feedback -
[>] It will help directly shape our emerging roadmap
[>] https://forms.office.com/e/eSr7EFAfCG
library(ggplot2)library(dplyr)
Attaching package: 'dplyr'
The following objects are masked from 'package:stats':

    filter, lag
The following objects are masked from 'package:base':

    intersect, setdiff, setequal, union
# Setup data to have Z scores and some known betassetup_data <-function(a) { a$z <- a$beta / a$se a$beta_known <-NA a$se_known <-NA index <-sample(1:nrow(a), nrow(a)*0.05) a$beta_known[index] <- a$beta[index] a$se_known[index] <- a$se[index]return(a)}# Function to convert Z to betamake_beta <-function(dat) { dat$senew <-1/sqrt(2* dat$eaf * (1- dat$eaf) * dat$n) dat$betanew <- dat$z * dat$senew correction <-lm(dat$betanew ~ dat$beta_known)$coef[2] dat$betanew <- dat$betanew / correction dat$senew <- dat$senew / correctionreturn(dat)}
Get LDL cholesterol region as an example
a <-associations("1:11000000-12000000", "ieu-a-300") %>%setup_data()a <-make_beta(a)cor(a$beta, a$betanew, use="pair")
[1] 0.9751509
summary(lm(a$beta ~ a$betanew))
Call:
lm(formula = a$beta ~ a$betanew)

Residuals:
      Min        1Q    Median        3Q       Max
-0.044206 -0.000829  0.000218  0.000906  0.014450

Coefficients:
              Estimate Std. Error t value Pr(>|t|)
(Intercept) -4.456e-04  9.237e-05  -4.824  1.7e-06 ***
a$betanew    8.591e-01  7.047e-03 121.903  < 2e-16 ***
---
Signif. codes:  0 '***' 0.001 '**' 0.01 '*' 0.05 '.' 0.1 ' ' 1

Residual standard error: 0.002518 on 767 degrees of freedom
  (65 observations deleted due to missingness)
Multiple R-squared:  0.9509,    Adjusted R-squared:  0.9509
F-statistic: 1.486e+04 on 1 and 767 DF,  p-value: < 2.2e-16
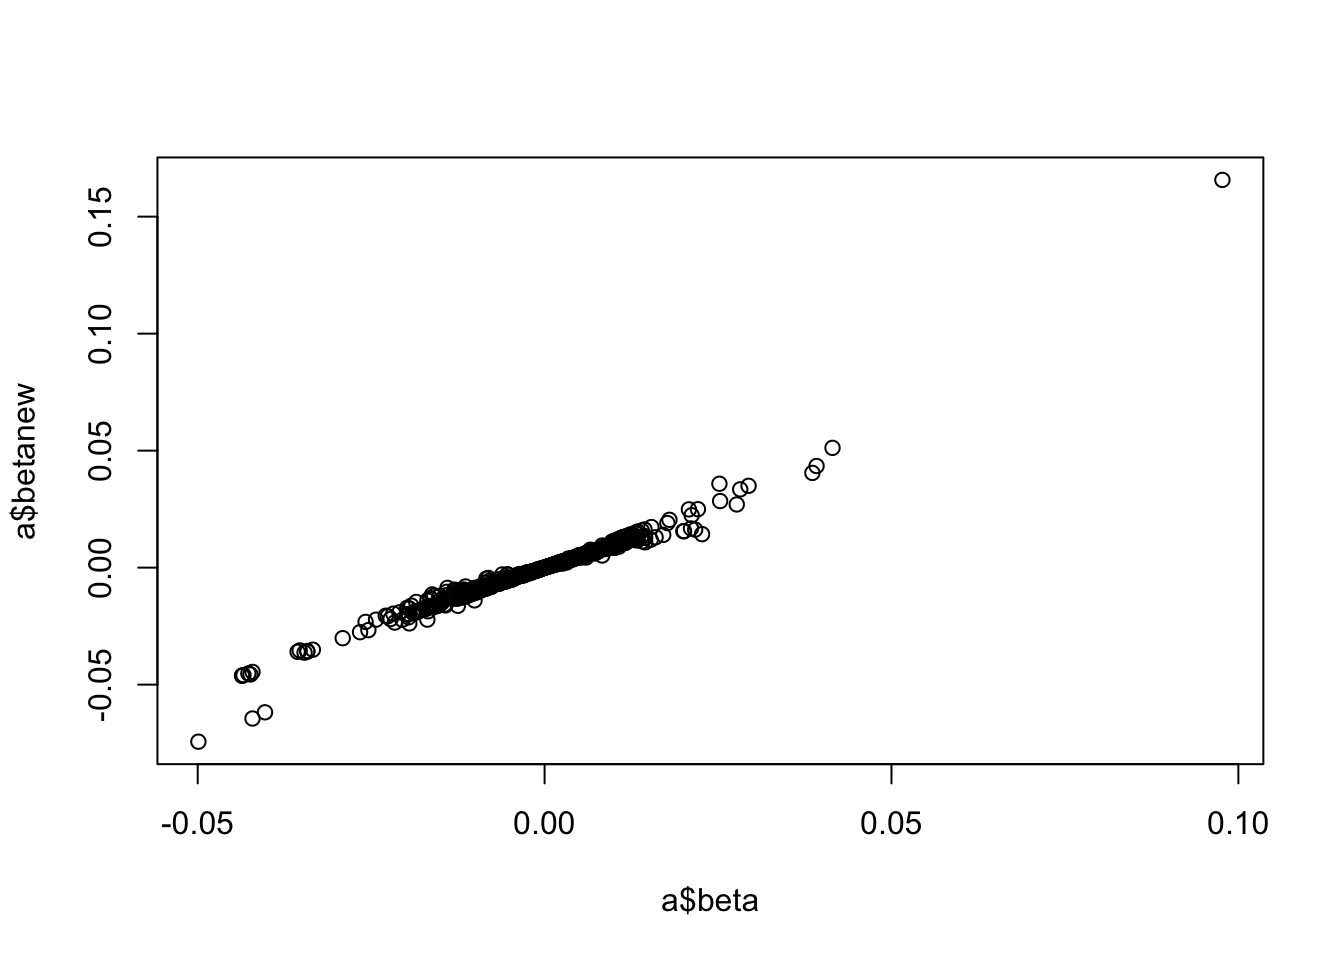
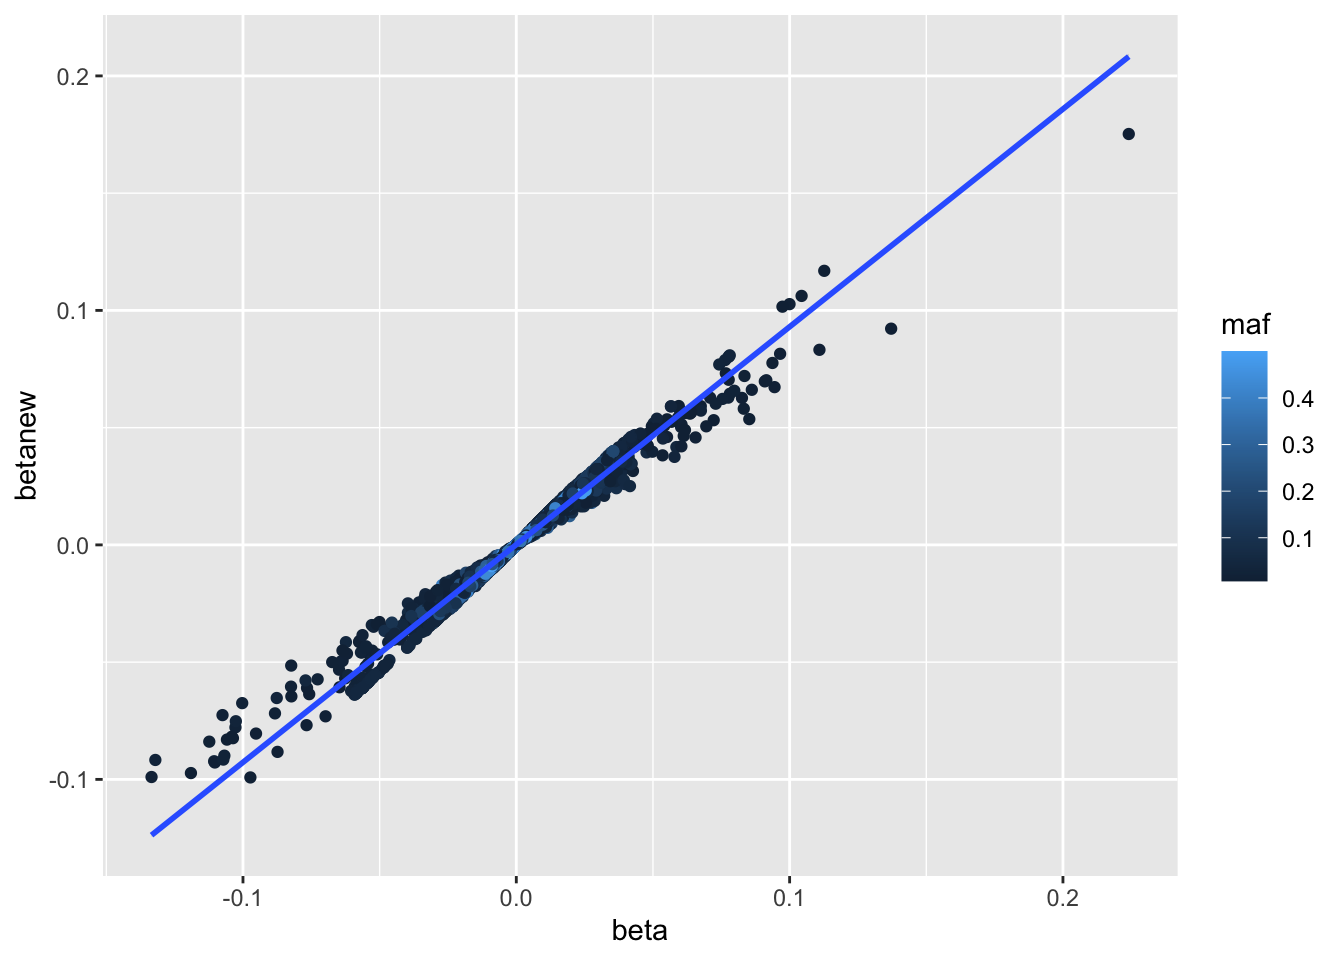
plot(a$beta, a$betanew)
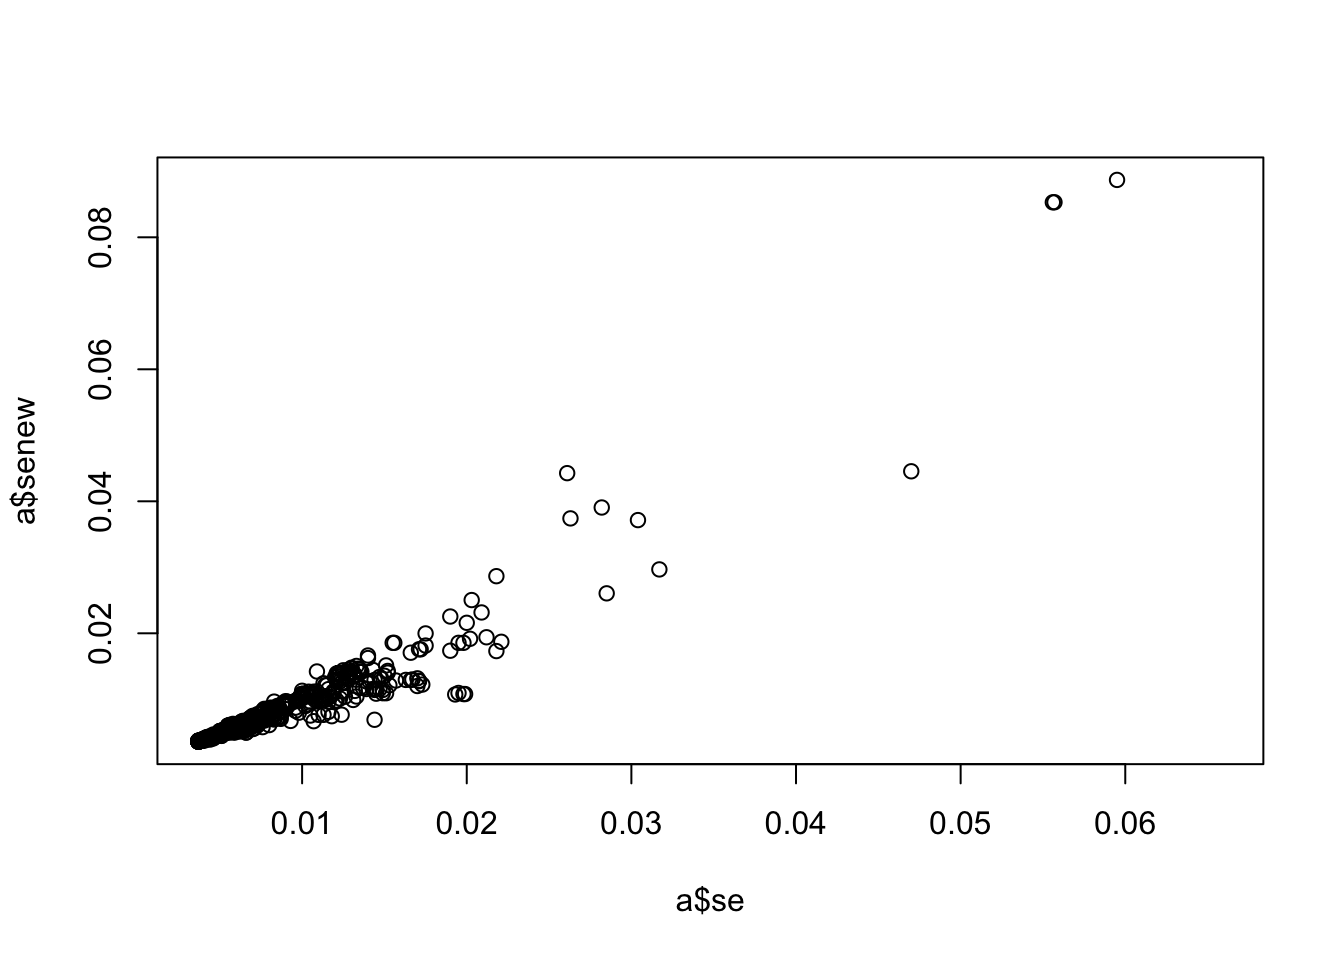
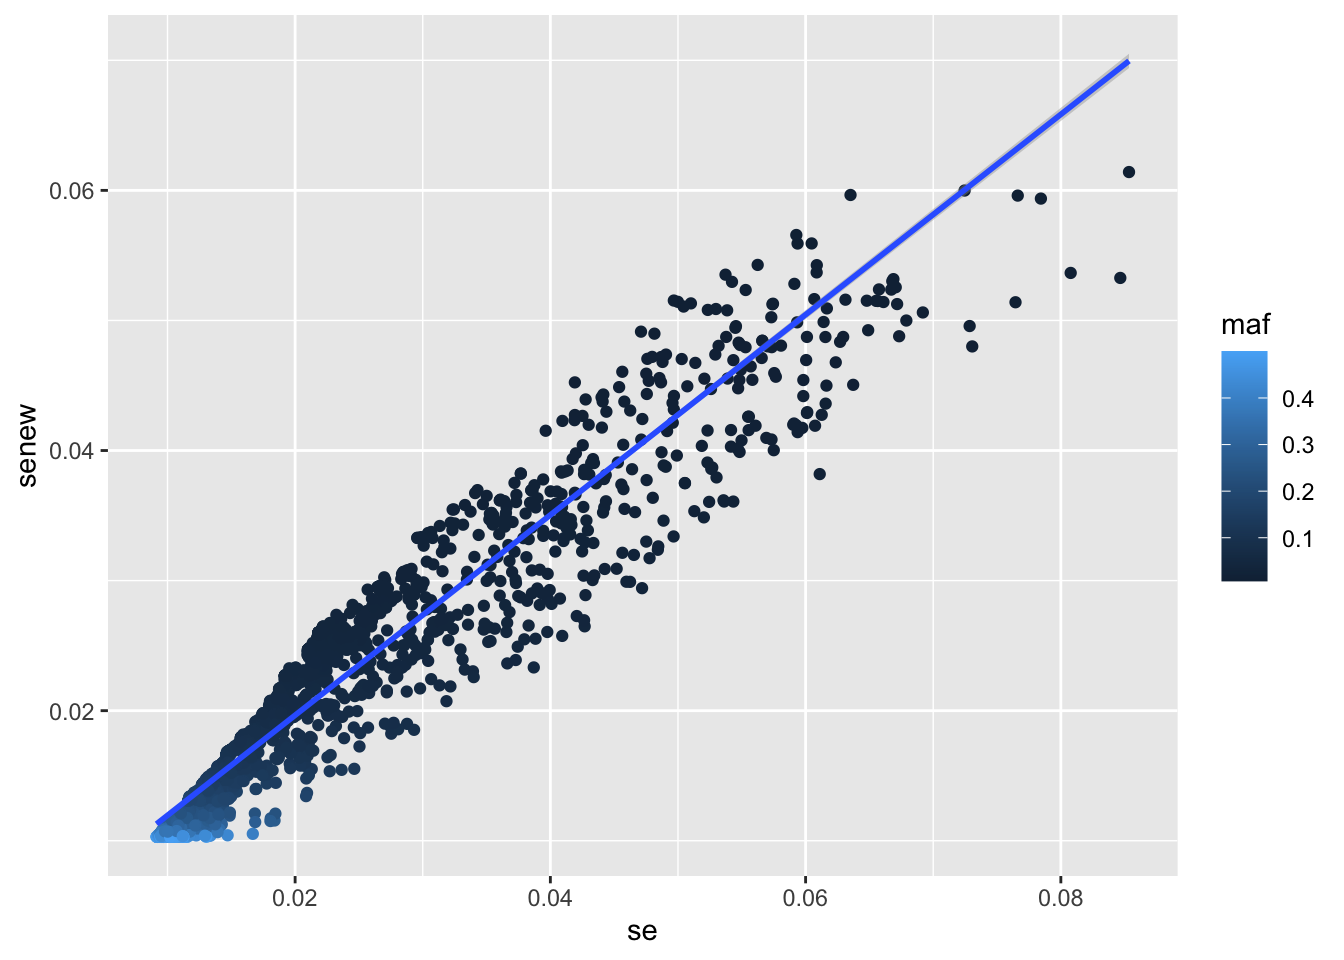
plot(a$se, a$senew)
Case control study example
Use CHD
b <-associations("1:11000000-12000000", "ieu-a-7") %>%setup_data()b <-make_beta(b)cor(b$beta, b$betanew, use="pair")
[1] 0.9868891
summary(lm(b$beta ~ b$betanew))
Call:
lm(formula = b$beta ~ b$betanew)

Residuals:
      Min        1Q    Median        3Q       Max
-0.035710 -0.001275  0.000141  0.001254  0.040604

Coefficients:
              Estimate Std. Error t value Pr(>|t|)
(Intercept) -1.644e-04  6.768e-05  -2.428   0.0152 *
b$betanew    1.049e+00  3.073e-03 341.322   <2e-16 ***
---
Signif. codes:  0 '***' 0.001 '**' 0.01 '*' 0.05 '.' 0.1 ' ' 1

Residual standard error: 0.003779 on 3116 degrees of freedom
Multiple R-squared:  0.974, Adjusted R-squared:  0.9739
F-statistic: 1.165e+05 on 1 and 3116 DF,  p-value: < 2.2e-16
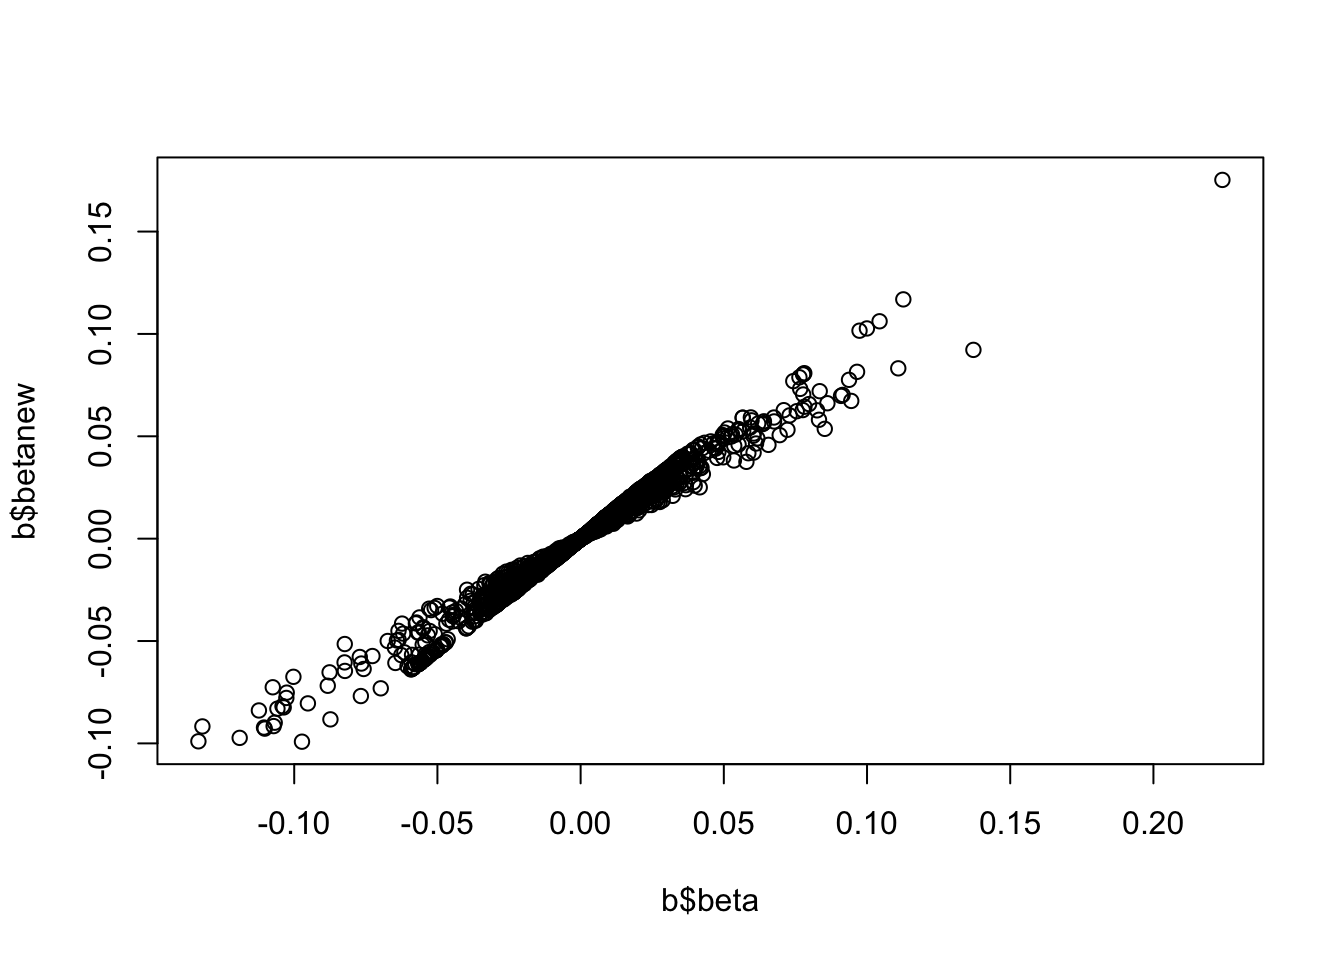
plot(b$beta, b$betanew)
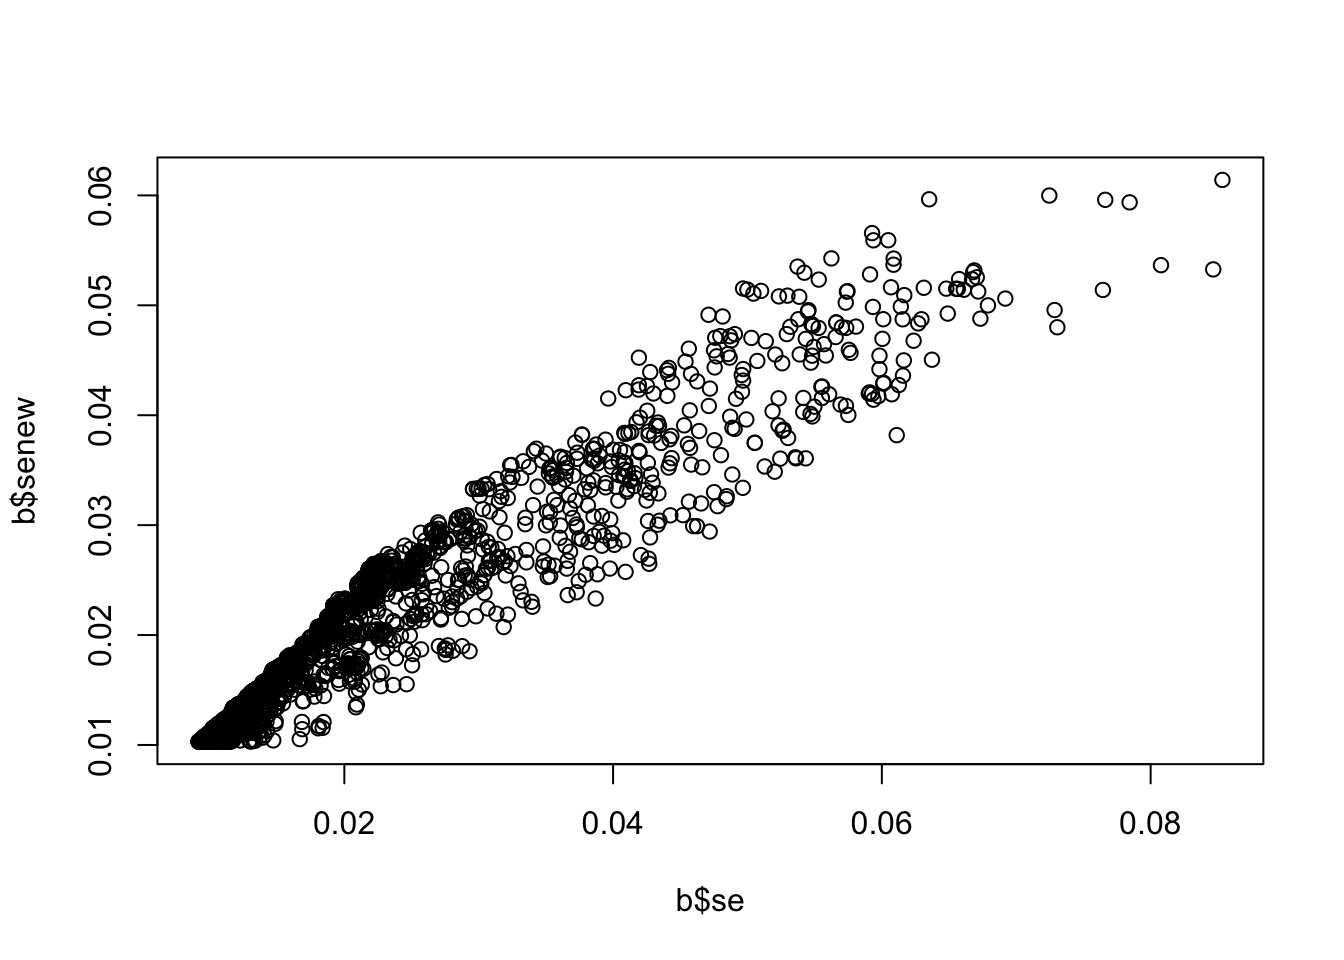
plot(b$se, b$senew)
Deviation from expectation?
Some deviation - most likely due to different sample sizes across SNPs. Can check that the deviation doesn’t track with allele frequency