library(dplyr)
Attaching package: 'dplyr'The following objects are masked from 'package:stats':
filter, lagThe following objects are masked from 'package:base':
intersect, setdiff, setequal, unionlibrary(ggplot2)Suppose study is split into two batches, where one is enriched for ADHD cases. Given the PRS assoc with ADHD before and after adjusting for batch, we can explore the magnitude of collider bias that might arise due to adjusting for batch.
Model:
g -> x <- ywhere x is a case/control variable, and is split into two batches, and one batch is enriched for cases.
library(dplyr)
Attaching package: 'dplyr'The following objects are masked from 'package:stats':
filter, lagThe following objects are masked from 'package:base':
intersect, setdiff, setequal, unionlibrary(ggplot2)Basic data generating model
fn <- function(n, af, bgx, px, byx, nbatch) {
    g <- rbinom(n, 2, af)
    y <- rnorm(n)
    x <- rbinom(n, 1, plogis(-1 + scale(g) * bgx + y * byx + rnorm(n)))
    bp <- x
    bp[x == 1] <- px
    bp[x == 0] <- 1-px
    ind <- sample(1:n, nbatch, replace=FALSE, prob=bp)
    b <- as.numeric(1:n %in% ind)

    mod <- function(f) {
        o <- summary(lm(as.formula(f))) %>%
        coef() %>% as_tibble() %>% slice_tail(n=1)
        names(o) <- c("b", "se", "tval", "pval")
        o$model <- f
        o
    }

    bind_rows(
        mod("y ~ g"),
        mod("y ~ b + g"),
        mod("y ~ x + g"),
        mod("x ~ g"),
        mod("x ~ b + g")
    )
}

fn(100000, 0.4, 0.5, 0.5, 10000)
# A tibble: 5 × 5
b se tval pval model
<dbl> <dbl> <dbl> <dbl> <chr>
1 -0.00225 0.00459 -0.490 0.624 y ~ g
2 -0.00225 0.00459 -0.490 0.624 y ~ b + g
3 0.00337 0.00276 1.22 0.222 y ~ x + g
4 -0.00351 0.00229 -1.54 0.125 x ~ g
5 -0.00351 0.00229 -1.54 0.125 x ~ b + gDefine parameters
param <- expand.grid(
    n = 100000,
    af = 0.4,
    bgx = sqrt(c(0.2, 0.01)),
    px = c(0.5, 0.9),
    byx = seq(0, 0.9, 0.1),
    nbatch = c(10000),
    sim=1:10
) %>% as_tibble()
param
# A tibble: 400 × 7
n af bgx px byx nbatch sim
<dbl> <dbl> <dbl> <dbl> <dbl> <dbl> <int>
1 100000 0.4 0.447 0.5 0 10000 1
2 100000 0.4 0.1 0.5 0 10000 1
3 100000 0.4 0.447 0.9 0 10000 1
4 100000 0.4 0.1 0.9 0 10000 1
5 100000 0.4 0.447 0.5 0.1 10000 1
6 100000 0.4 0.1 0.5 0.1 10000 1
7 100000 0.4 0.447 0.9 0.1 10000 1
8 100000 0.4 0.1 0.9 0.1 10000 1
9 100000 0.4 0.447 0.5 0.2 10000 1
10 100000 0.4 0.1 0.5 0.2 10000 1
# ℹ 390 more rowsRun simulation across all parameters
res <- lapply(1:nrow(param), \(i) {
    o <- fn(param$n[i], param$af[i], param$bgx[i], param$px[i], param$byx[i], param$nbatch[i])
    bind_cols(param[i,], o)
}) %>% bind_rows()
How does g->y test statistic relate to different biases? (Should always be null)
res %>%
    filter(model == "y ~ b + g") %>%
    {
        ggplot(., aes(x=byx, y=tval, color=as.factor(px))) +
        geom_point() +
        geom_smooth(method="lm") +
        facet_wrap(px ~ bgx)
    }
`geom_smooth()` using formula = 'y ~ x'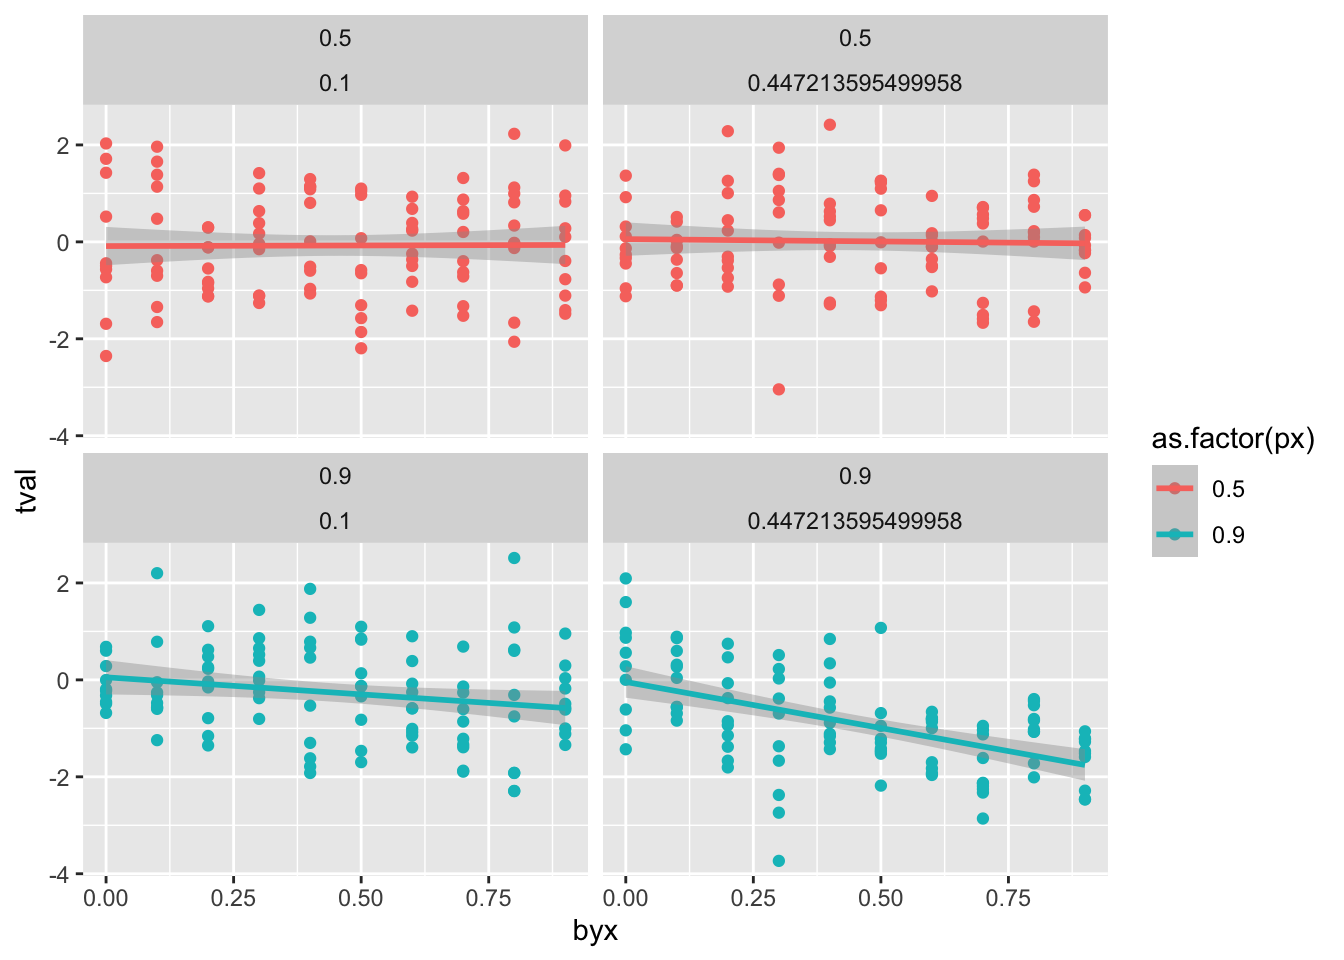
How does g->x test statistic change when adjusting for batch across parameters?
res %>%
    filter(model %in% c("x ~ b + g", "x ~ g")) %>%
    group_by(byx, px, bgx, sim) %>%
    summarise(bdiff = diff(b)) %>%
    {
        ggplot(., aes(x=byx, y=bdiff, color=as.factor(px))) +
        geom_point() +
        geom_smooth(method="lm") +
        facet_wrap(px ~ bgx)
    }
`summarise()` has grouped output by 'byx', 'px', 'bgx'. You can override using
the `.groups` argument.
`geom_smooth()` using formula = 'y ~ x'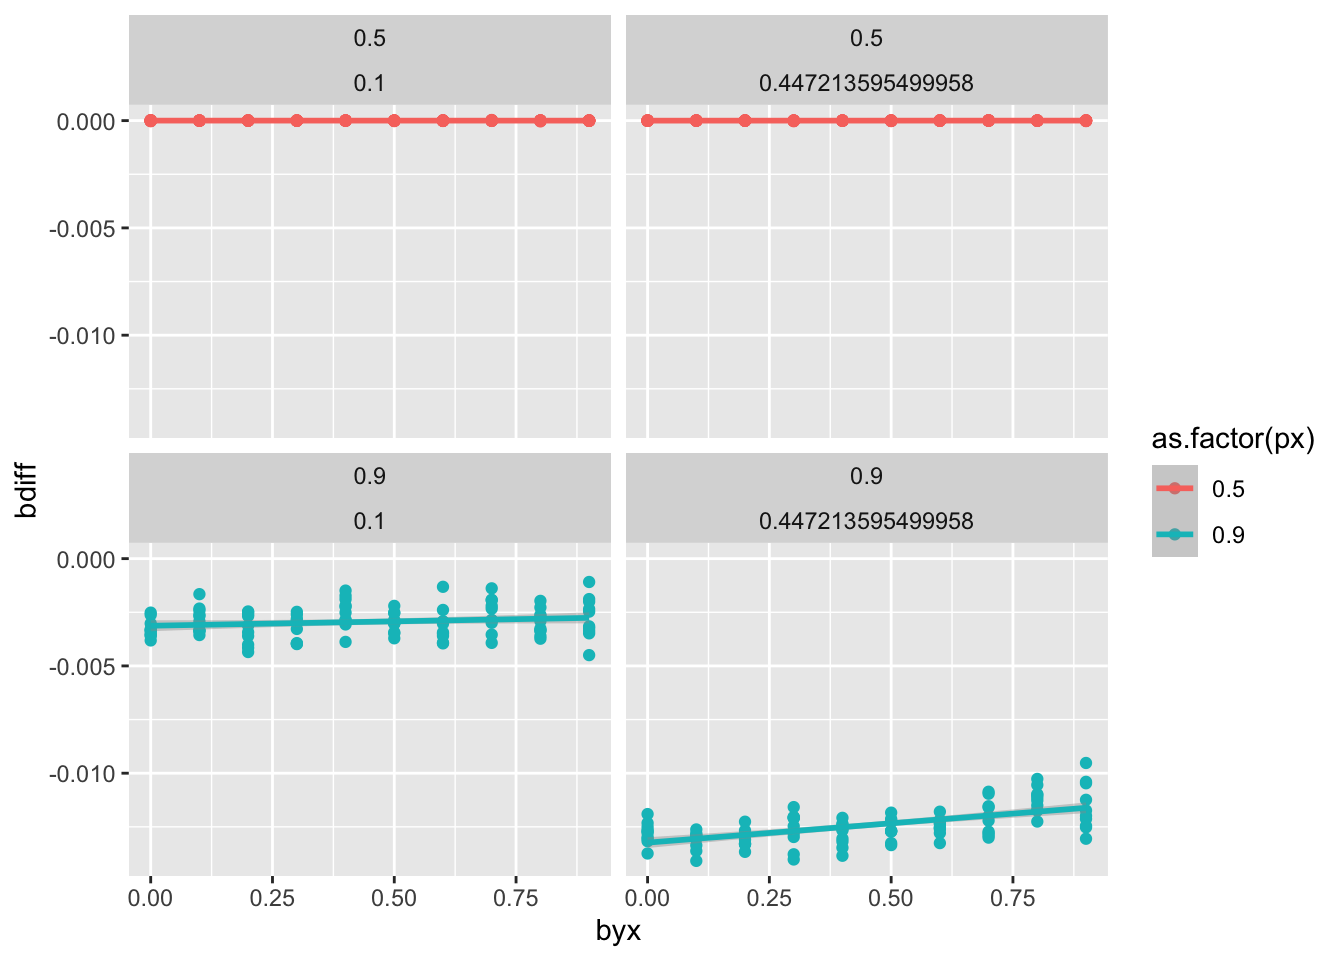
Need huge effects of target trait y on x (ADHD) in order to induce any sort of meaningful collider bias unless batch is composed entirely of cases.
sessionInfo()R version 4.3.3 (2024-02-29)
Platform: aarch64-apple-darwin20 (64-bit)
Running under: macOS Ventura 13.6
Matrix products: default
BLAS: /Library/Frameworks/R.framework/Versions/4.3-arm64/Resources/lib/libRblas.0.dylib
LAPACK: /Library/Frameworks/R.framework/Versions/4.3-arm64/Resources/lib/libRlapack.dylib; LAPACK version 3.11.0
locale:
[1] en_GB.UTF-8/en_GB.UTF-8/en_GB.UTF-8/C/en_GB.UTF-8/en_GB.UTF-8
time zone: Europe/London
tzcode source: internal
attached base packages:
[1] stats graphics grDevices utils datasets methods base
other attached packages:
[1] ggplot2_3.4.2 dplyr_1.1.4
loaded via a namespace (and not attached):
[1] vctrs_0.6.5 nlme_3.1-164 cli_3.6.2 knitr_1.45
[5] rlang_1.1.3 xfun_0.42 generics_0.1.3 jsonlite_1.8.8
[9] labeling_0.4.2 glue_1.7.0 colorspace_2.1-0 htmltools_0.5.7
[13] scales_1.2.1 fansi_1.0.6 rmarkdown_2.26 grid_4.3.3
[17] munsell_0.5.0 evaluate_0.23 tibble_3.2.1 fastmap_1.1.1
[21] yaml_2.3.8 lifecycle_1.0.4 compiler_4.3.3 htmlwidgets_1.6.3
[25] pkgconfig_2.0.3 mgcv_1.9-1 farver_2.1.1 lattice_0.22-5
[29] digest_0.6.34 R6_2.5.1 tidyselect_1.2.0 utf8_1.2.4
[33] splines_4.3.3 pillar_1.9.0 magrittr_2.0.3 Matrix_1.6-5
[37] withr_3.0.0 tools_4.3.3 gtable_0.3.3