library(dplyr)
Attaching package: 'dplyr'The following objects are masked from 'package:stats':
filter, lagThe following objects are masked from 'package:base':
intersect, setdiff, setequal, unionlibrary(tidyr)
library(ggplot2)Do p-values deflate when the variant is rare?
library(dplyr)
Attaching package: 'dplyr'The following objects are masked from 'package:stats':
filter, lagThe following objects are masked from 'package:base':
intersect, setdiff, setequal, unionlibrary(tidyr)
library(ggplot2)Family simulation function
# adapted from https://github.com/MRCIEU/mrtwin_power/blob/master/scripts/sib_mr_functions.r
# 3 sibs per family
# skewed phenotype
make_families <- function(af, nfam, error=0) {
    nsnp <- length(af)
    dads <- matrix(0, nfam, nsnp)
    mums <- matrix(0, nfam, nsnp)
    sibs1 <- matrix(0, nfam, nsnp)
    sibs2 <- matrix(0, nfam, nsnp)
    sibs3 <- matrix(0, nfam, nsnp)
    for(i in 1:nsnp)
    {
        dad1 <- rbinom(nfam, 1, af[i]) + 1
        dad2 <- (rbinom(nfam, 1, af[i]) + 1) * -1
        mum1 <- rbinom(nfam, 1, af[i]) + 1
        mum2 <- (rbinom(nfam, 1, af[i]) + 1) * -1

        dadindex <- sample(c(TRUE, FALSE), nfam, replace=TRUE)
        dadh <- rep(NA, nfam)
        dadh[dadindex] <- dad1[dadindex]
        dadh[!dadindex] <- dad2[!dadindex]

        mumindex <- sample(c(TRUE, FALSE), nfam, replace=TRUE)
        mumh <- rep(NA, nfam)
        mumh[mumindex] <- mum1[mumindex]
        mumh[!mumindex] <- mum2[!mumindex]

        sib1 <- cbind(dadh, mumh)

        dadindex <- sample(c(TRUE, FALSE), nfam, replace=TRUE)
        dadh <- rep(NA, nfam)
        dadh[dadindex] <- dad1[dadindex]
        dadh[!dadindex] <- dad2[!dadindex]

        mumindex <- sample(c(TRUE, FALSE), nfam, replace=TRUE)
        mumh <- rep(NA, nfam)
        mumh[mumindex] <- mum1[mumindex]
        mumh[!mumindex] <- mum2[!mumindex]

        sib2 <- cbind(dadh, mumh)

        dadindex <- sample(c(TRUE, FALSE), nfam, replace=TRUE)
        dadh <- rep(NA, nfam)
        dadh[dadindex] <- dad1[dadindex]
        dadh[!dadindex] <- dad2[!dadindex]

        mumindex <- sample(c(TRUE, FALSE), nfam, replace=TRUE)
        mumh <- rep(NA, nfam)
        mumh[mumindex] <- mum1[mumindex]
        mumh[!mumindex] <- mum2[!mumindex]

        sib3 <- cbind(dadh, mumh)

        sibs1[,i] <- rowSums(abs(sib1) - 1)
        sibs2[,i] <- rowSums(abs(sib2) - 1)
        sibs3[,i] <- rowSums(abs(sib3) - 1)
        dads[,i] <- dad1 - 1 + abs(dad2) - 1
        mums[,i] <- mum1 - 1 + abs(mum2) - 1

    }

    sibs1 <- as_tibble(sibs1)
    sibs2 <- as_tibble(sibs2)
    sibs3 <- as_tibble(sibs3)
    sdat <- bind_rows(
        tibble(fid = 1:nfam, iid = paste0(1:nfam, "a"), sibs1),
        tibble(fid = 1:nfam, iid = paste0(1:nfam, "b"), sibs2),
        tibble(fid = 1:nfam, iid = paste0(1:nfam, "b"), sibs3)
    )
    sdat$V1 <- sdat$V1 + rnorm(nrow(sdat), 0, sd=error)
    sdat <- sdat %>% group_by(fid) %>%
        mutate(
            FG = mean(V1),
            CG = FG - V1,
            sex = rbinom(n(), 1, 0.5),
            phen = rbeta(n(), 1, 5)
        ) %>%
        ungroup()

    return(sdat)
}
Example
a <- make_families(0.01, 10000)Warning: The `x` argument of `as_tibble.matrix()` must have unique column names if
`.name_repair` is omitted as of tibble 2.0.0.
ℹ Using compatibility `.name_repair`.str(a)tibble [30,000 × 7] (S3: tbl_df/tbl/data.frame)
$ fid : int [1:30000] 1 2 3 4 5 6 7 8 9 10 ...
$ iid : chr [1:30000] "1a" "2a" "3a" "4a" ...
$ V1 : num [1:30000] 0 0 0 0 0 0 0 0 0 1 ...
$ FG : num [1:30000] 0 0 0 0 0 ...
$ CG : num [1:30000] 0 0 0 0 0 ...
$ sex : int [1:30000] 1 1 1 1 1 0 0 0 1 1 ...
$ phen: num [1:30000] 0.1029 0.2683 0.1351 0.1688 0.0277 ...summary(lm(phen ~ FG + CG, a))
Call:
lm(formula = phen ~ FG + CG, data = a)

Residuals:
     Min       1Q   Median       3Q      Max
-0.16700 -0.11173 -0.03695  0.07566  0.70842

Coefficients:
              Estimate Std. Error t value Pr(>|t|)
(Intercept)  0.1670052  0.0008247 202.501   <2e-16 ***
FG          -0.0007463  0.0071542  -0.104    0.917
CG          -0.0008002  0.0102352  -0.078    0.938
---
Signif. codes:  0 '***' 0.001 '**' 0.01 '*' 0.05 '.' 0.1 ' ' 1

Residual standard error: 0.1408 on 29997 degrees of freedom
Multiple R-squared:  5.665e-07, Adjusted R-squared:  -6.611e-05
F-statistic: 0.008497 on 2 and 29997 DF,  p-value: 0.9915
Perform analysis over a range of rare allele frequencies
param <- expand.grid(
    nsim = 1:20,
    af = c(seq(0.00005, 0.0005, by=0.00005)),
    pvalCG = NA,
    pvalFG = NA
)

res <- lapply(1:nrow(param), \(i) {
    a <- make_families(param$af[i], 10000)

    tryCatch({
        res <- summary(lm(phen ~ CG + FG + sex, a))
        p <- param[i, ]
        p$pvalCG <- res$coef[2,4]
        p$pvalFG <- res$coef[3,4]
    }, error = function(e) {
        return(NULL)
    })
    return(p)
}) %>% bind_rows()ggplot(res, aes(x=af, y=pvalFG)) +
geom_point() +
geom_smooth() +
scale_x_log10()`geom_smooth()` using method = 'loess' and formula = 'y ~ x'Warning: Removed 5 rows containing non-finite outside the scale range
(`stat_smooth()`).Warning: Removed 5 rows containing missing values or values outside the scale range
(`geom_point()`).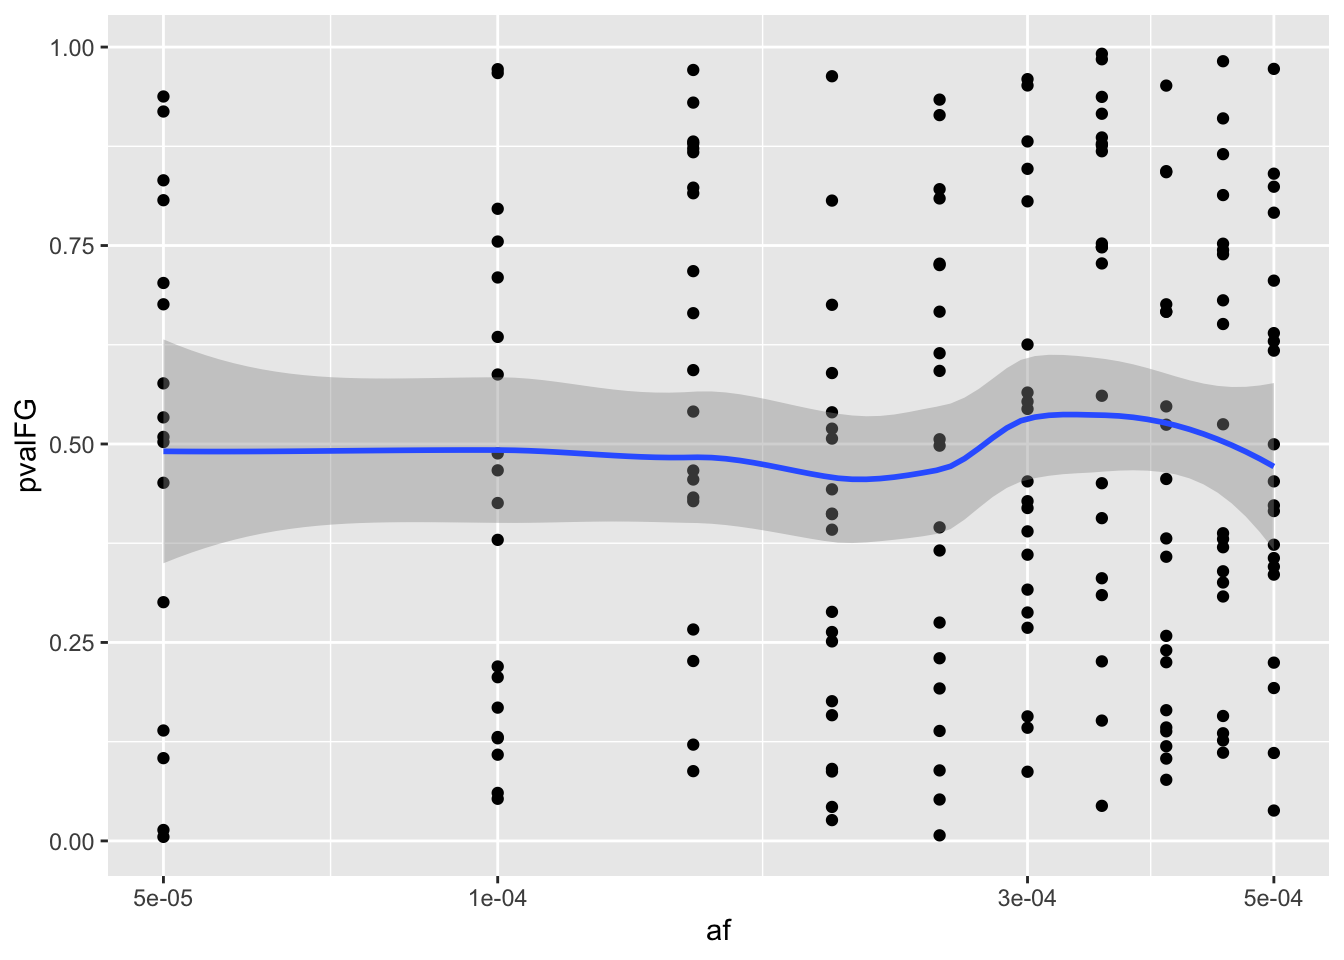
ggplot(res, aes(x=af, y=pvalCG)) +
geom_point() +
geom_smooth() +
scale_x_log10()
`geom_smooth()` using method = 'loess' and formula = 'y ~ x'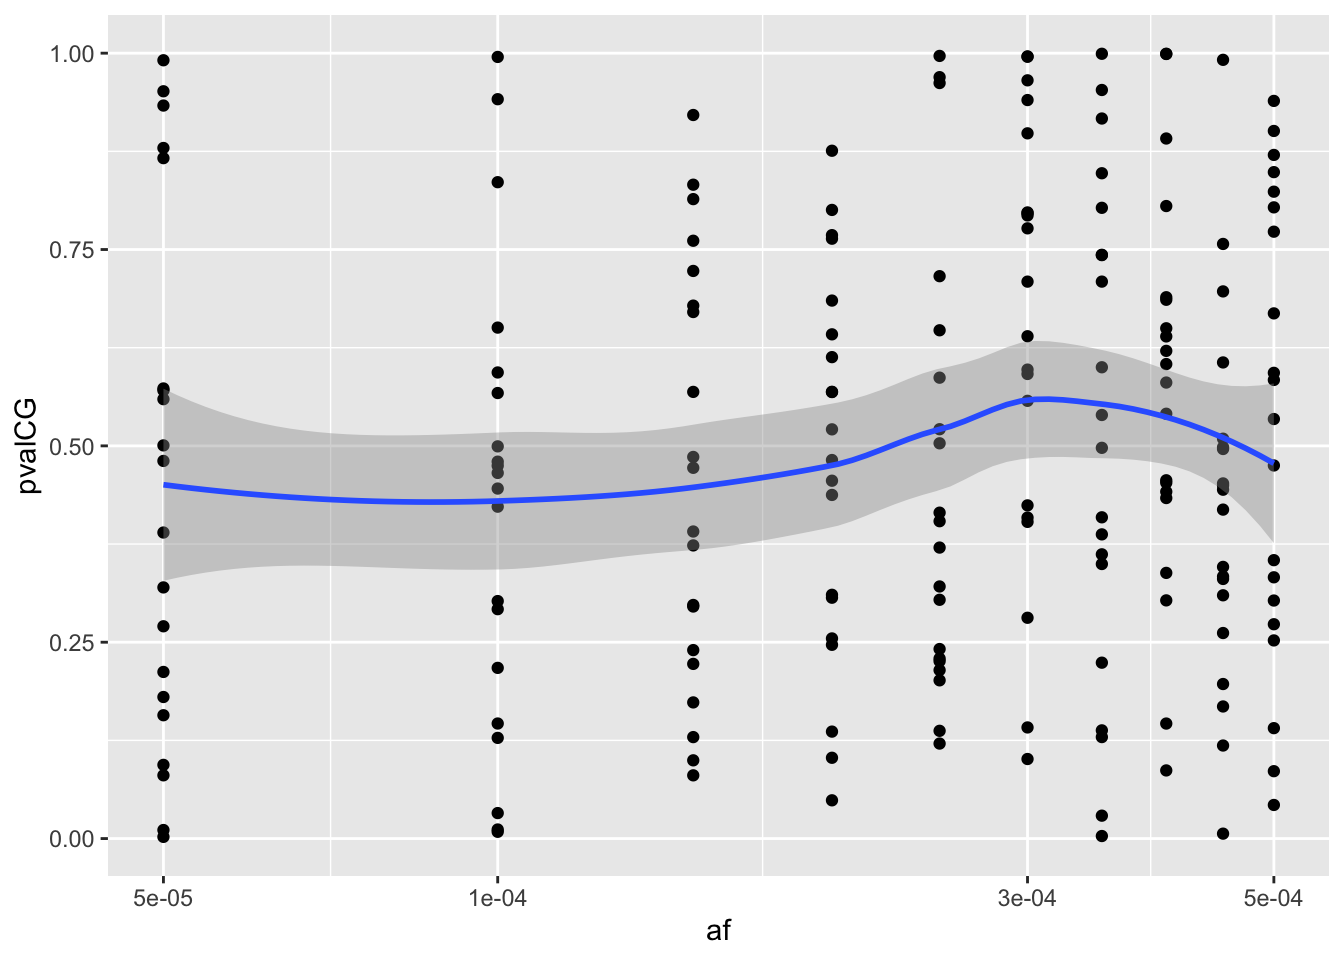
No obvious deflation of test statistics
sessionInfo()R version 4.3.3 (2024-02-29)
Platform: x86_64-apple-darwin20 (64-bit)
Running under: macOS Ventura 13.6
Matrix products: default
BLAS: /Library/Frameworks/R.framework/Versions/4.3-x86_64/Resources/lib/libRblas.0.dylib
LAPACK: /Library/Frameworks/R.framework/Versions/4.3-x86_64/Resources/lib/libRlapack.dylib; LAPACK version 3.11.0
locale:
[1] en_GB.UTF-8/en_GB.UTF-8/en_GB.UTF-8/C/en_GB.UTF-8/en_GB.UTF-8
time zone: Europe/London
tzcode source: internal
attached base packages:
[1] stats graphics grDevices utils datasets methods base
other attached packages:
[1] ggplot2_3.5.0 tidyr_1.3.1 dplyr_1.1.3
loaded via a namespace (and not attached):
[1] Matrix_1.6-5 gtable_0.3.4 jsonlite_1.8.7 compiler_4.3.3
[5] tidyselect_1.2.0 splines_4.3.3 scales_1.3.0 yaml_2.3.7
[9] fastmap_1.1.1 lattice_0.22-5 R6_2.5.1 labeling_0.4.3
[13] generics_0.1.3 knitr_1.45 htmlwidgets_1.6.2 tibble_3.2.1
[17] munsell_0.5.0 pillar_1.9.0 rlang_1.1.2 utf8_1.2.4
[21] xfun_0.41 cli_3.6.1 withr_2.5.2 magrittr_2.0.3
[25] mgcv_1.9-1 digest_0.6.33 grid_4.3.3 lifecycle_1.0.4
[29] nlme_3.1-164 vctrs_0.6.4 evaluate_0.23 glue_1.6.2
[33] farver_2.1.1 fansi_1.0.5 colorspace_2.1-0 rmarkdown_2.25
[37] purrr_1.0.2 tools_4.3.3 pkgconfig_2.0.3 htmltools_0.5.7