Differential vulnerability and susceptibility

Author

Gibran Hemani

Published

December 8, 2023

Background

library(ggplot2)
ggplot(NULL, aes(c(-5,5))) +
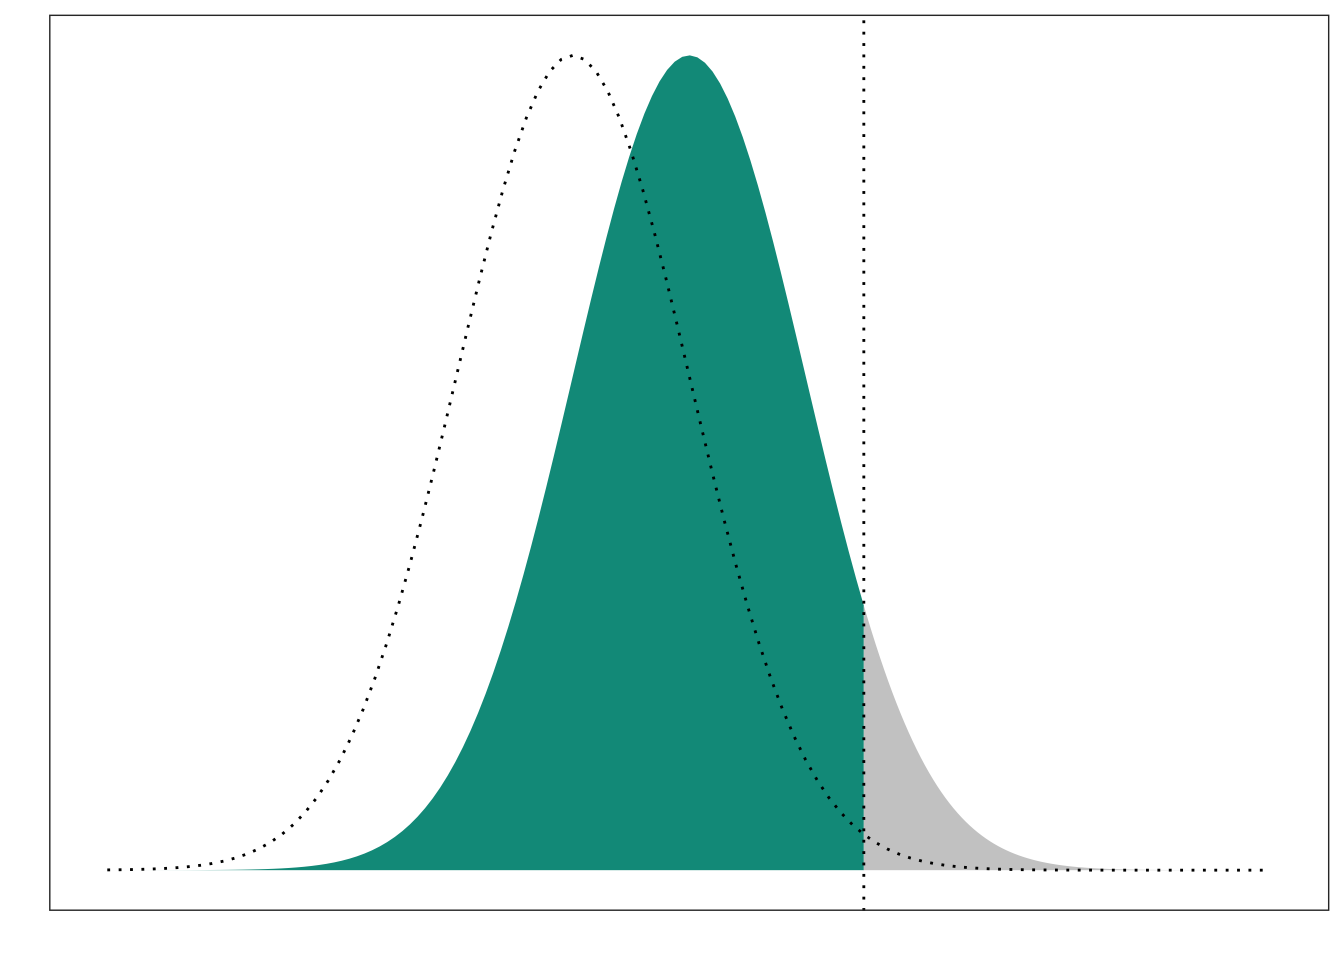
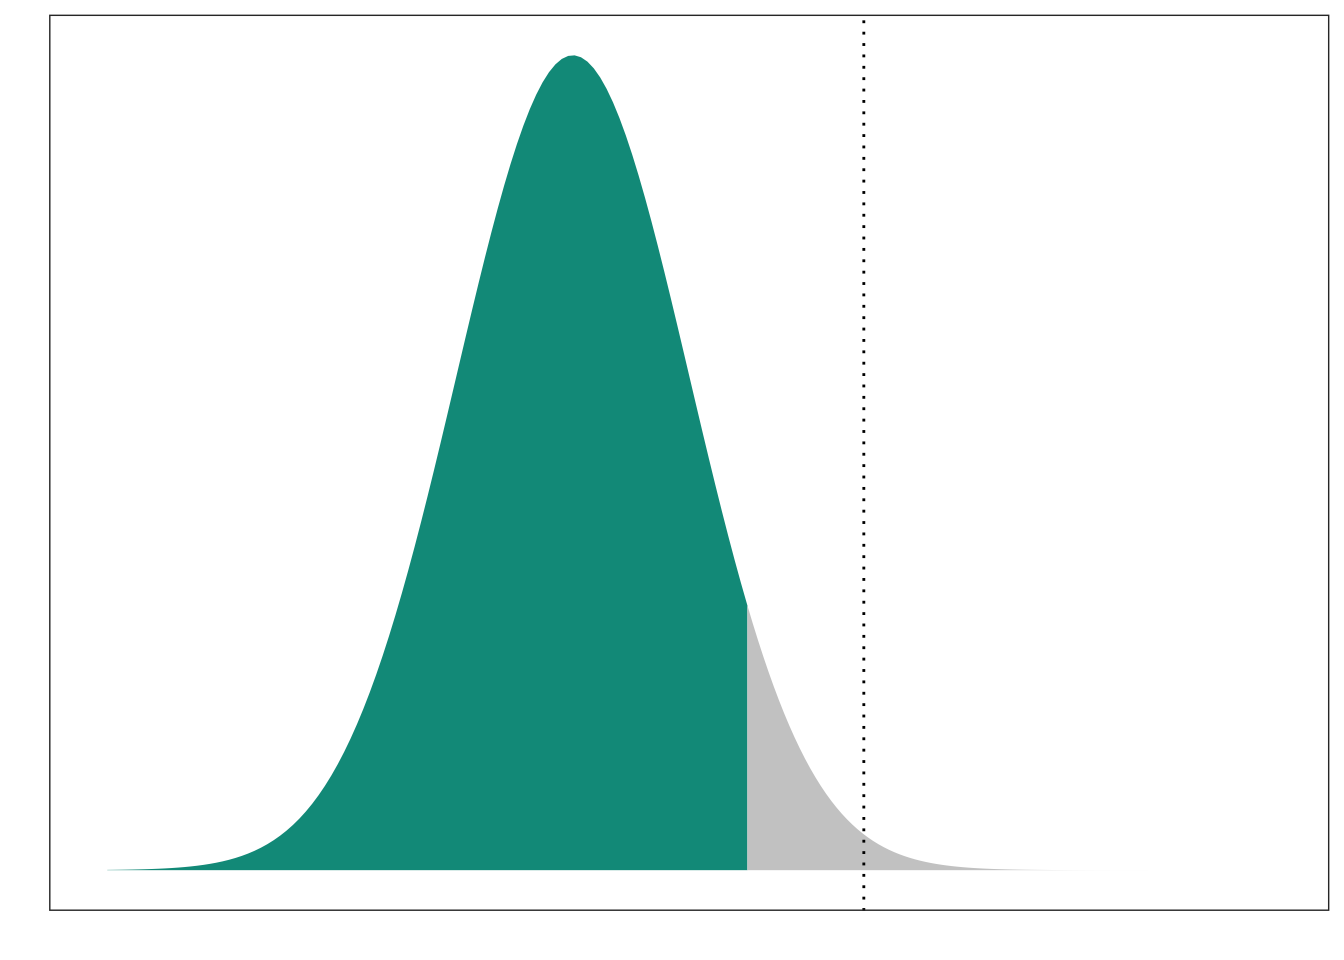
  geom_area(stat = "function", fun = \(x) dnorm(x, mean=-1), fill = "#00998a", xlim = c(-5, 1.5)) +
  geom_area(stat = "function", fun = \(x) dnorm(x, mean=-1), fill = "grey80", xlim = c(1.5, 5)) +
  geom_vline(xintercept=1.5, linetype="dotted") +
  labs(x = "", y = "") +
  scale_y_continuous(breaks = NULL) +
  scale_x_continuous(breaks = NULL) +
  theme_bw()

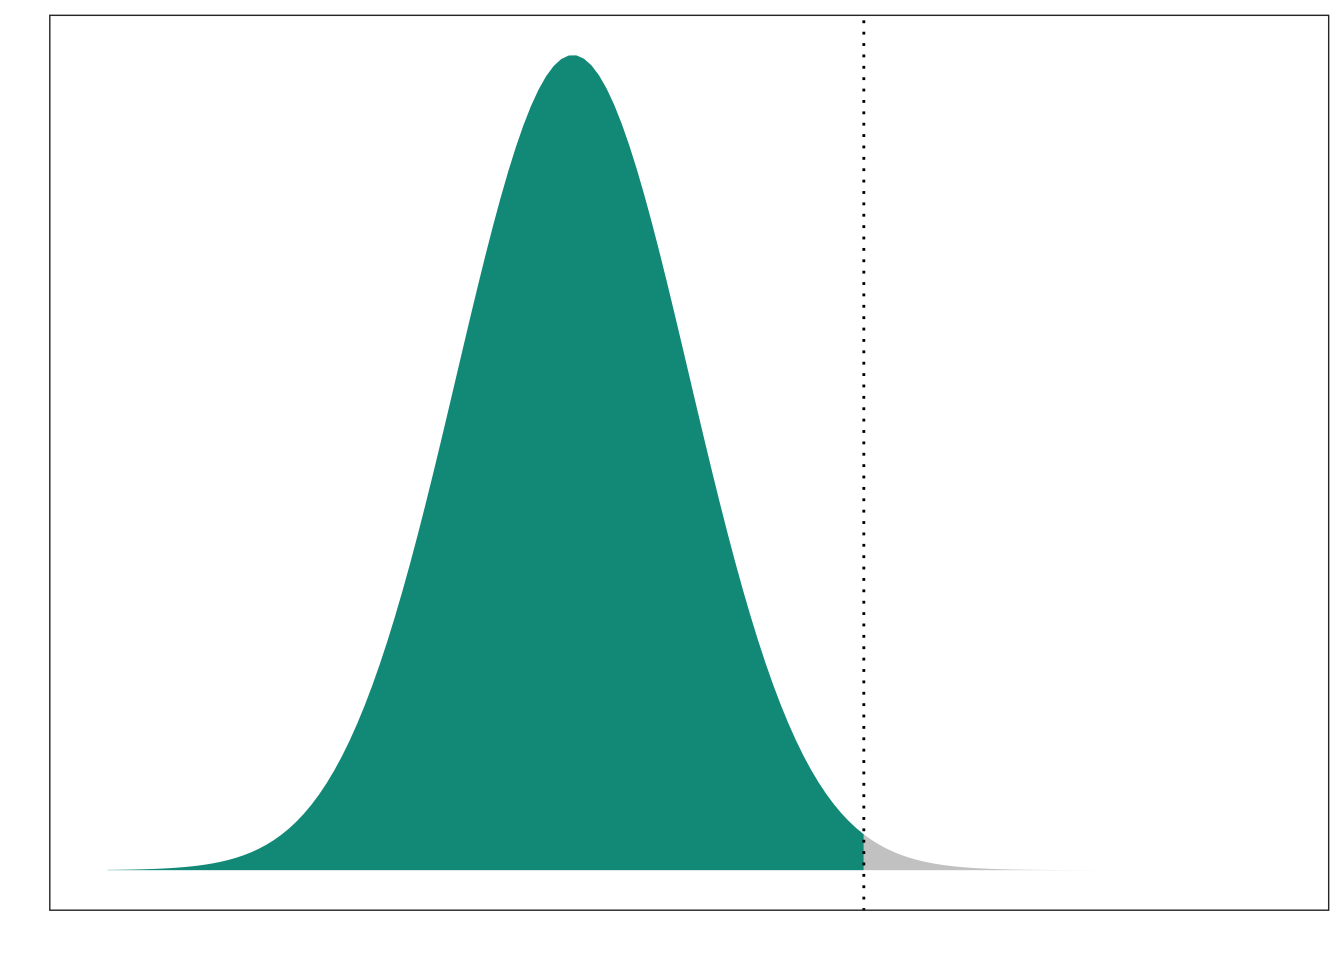
  ggsave(filename="pop1.pdf", width=5, height=2)
ggplot(NULL, aes(c(-5,5))) +
  geom_area(stat = "function", fun = \(x) dnorm(x, mean=0), fill = "#00998a", xlim = c(-5, 1.5)) +
  geom_area(stat = "function", fun = \(x) dnorm(x, mean=0), fill = "grey80", xlim = c(1.5, 5)) +
  geom_line(stat = "function", fun = \(x) dnorm(x, mean=-1), linetype="dotted", xlim = c(-5, 5)) +
  geom_vline(xintercept=1.5, linetype="dotted") +
  labs(x = "", y = "") +
  scale_y_continuous(breaks = NULL) +
  scale_x_continuous(breaks = NULL) +
  theme_bw()

  ggsave(filename="vuln.pdf", width=5, height=2)
ggplot(NULL, aes(c(-5,5))) +
  geom_area(stat = "function", fun = \(x) dnorm(x, mean=-1), fill = "#00998a", xlim = c(-5, 0.5)) +
  geom_area(stat = "function", fun = \(x) dnorm(x, mean=-1), fill = "grey80", xlim = c(0.5, 5)) +
  geom_vline(xintercept=1.5, linetype="dotted") +
  labs(x = "", y = "") +
  scale_y_continuous(breaks = NULL) +
  scale_x_continuous(breaks = NULL) +
  theme_bw()

  ggsave(filename="susc.pdf", width=5, height=2)

sessionInfo()
R version 4.3.2 (2023-10-31)
Platform: aarch64-apple-darwin20 (64-bit)
Running under: macOS Ventura 13.6

Matrix products: default
BLAS:   /Library/Frameworks/R.framework/Versions/4.3-arm64/Resources/lib/libRblas.0.dylib 
LAPACK: /Library/Frameworks/R.framework/Versions/4.3-arm64/Resources/lib/libRlapack.dylib;  LAPACK version 3.11.0

locale:
[1] en_GB.UTF-8/en_GB.UTF-8/en_GB.UTF-8/C/en_GB.UTF-8/en_GB.UTF-8

time zone: Europe/London
tzcode source: internal

attached base packages:
[1] stats     graphics  grDevices utils     datasets  methods   base     

other attached packages:
[1] ggplot2_3.4.2

loaded via a namespace (and not attached):
 [1] vctrs_0.6.4       cli_3.6.1         knitr_1.45        rlang_1.1.2      
 [5] xfun_0.41         generics_0.1.3    textshaping_0.3.7 jsonlite_1.8.7   
 [9] glue_1.6.2        colorspace_2.1-0  htmltools_0.5.7   ragg_1.2.6       
[13] scales_1.2.1      fansi_1.0.5       rmarkdown_2.25    grid_4.3.2       
[17] evaluate_0.23     munsell_0.5.0     tibble_3.2.1      fastmap_1.1.1    
[21] yaml_2.3.7        lifecycle_1.0.4   compiler_4.3.2    dplyr_1.1.4      
[25] htmlwidgets_1.6.3 pkgconfig_2.0.3   systemfonts_1.0.5 farver_2.1.1     
[29] digest_0.6.33     R6_2.5.1          tidyselect_1.2.0  utf8_1.2.4       
[33] pillar_1.9.0      magrittr_2.0.3    withr_2.5.2       tools_4.3.2      
[37] gtable_0.3.3