Background
Disease prevalence may change across ancestries but effect sizes stay the same. Does this lead to different effect estimates?
mean of risk factor changes - does it influence beta hat?
Attaching package: 'dplyr'
The following objects are masked from 'package:stats':

    filter, lag
The following objects are masked from 'package:base':

    intersect, setdiff, setequal, union
library(ggplot2)
p <- expand.grid(
b=c(-1, 0.5, 0, 0.5, 1),
m=seq(-0.8, 0.8, by=0.1),
bhat=NA,
prev=NA
)
n <- 10000
for(i in 1:nrow(p)) {
a <- rnorm(n, mean=p$m[i])
b <- a * p$b[i] + rnorm(n)
d <- rbinom(n, 1, plogis(b))
p$bhat[i] <- glm(d ~ a, family="binomial")$coef[2]
p$prev[i] <- mean(d)
}
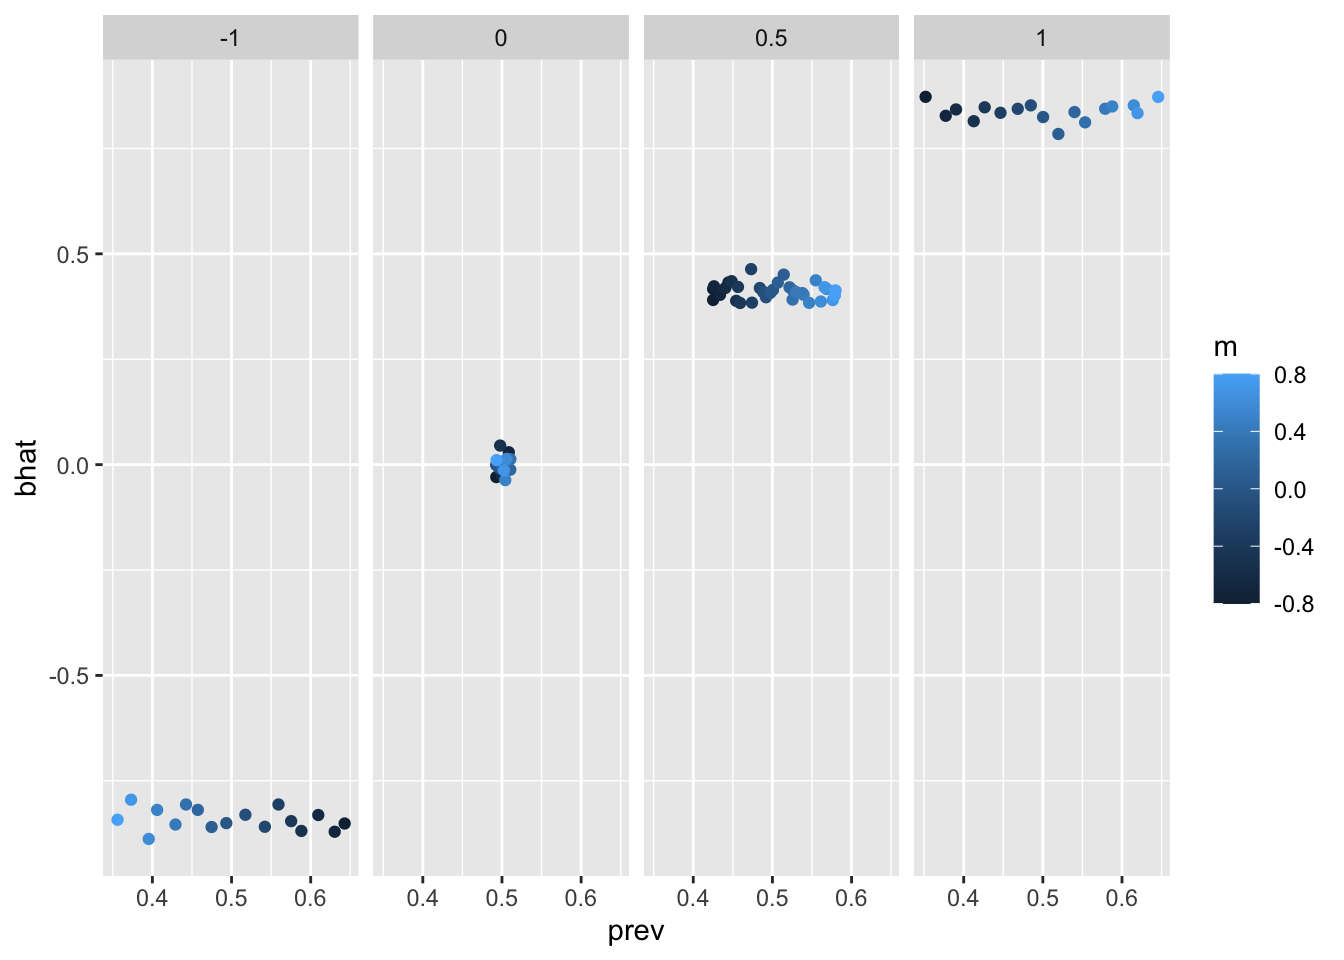
ggplot(p, aes(x=prev, y=bhat)) +
geom_point(aes(colour=m)) +
facet_grid(. ~ b)
no influence.
What about if prevalence changes due to another factor
p <- expand.grid(
b=c(-1, 0.5, 0, 0.5, 1),
m1=seq(-0.8, 0.8, by=0.1),
m2=seq(-0.8, 0.8, by=0.1),
bhat=NA,
prev=NA
)
n <- 10000
for(i in 1:nrow(p)) {
a <- rnorm(n, mean=p$m1[i])
a1 <- rnorm(n, mean=p$m2[i])
b <- a * p$b[i] + rnorm(n) + a1
d <- rbinom(n, 1, plogis(b))
p$bhat[i] <- glm(d ~ a, family="binomial")$coef[2]
p$prev[i] <- mean(d)
}
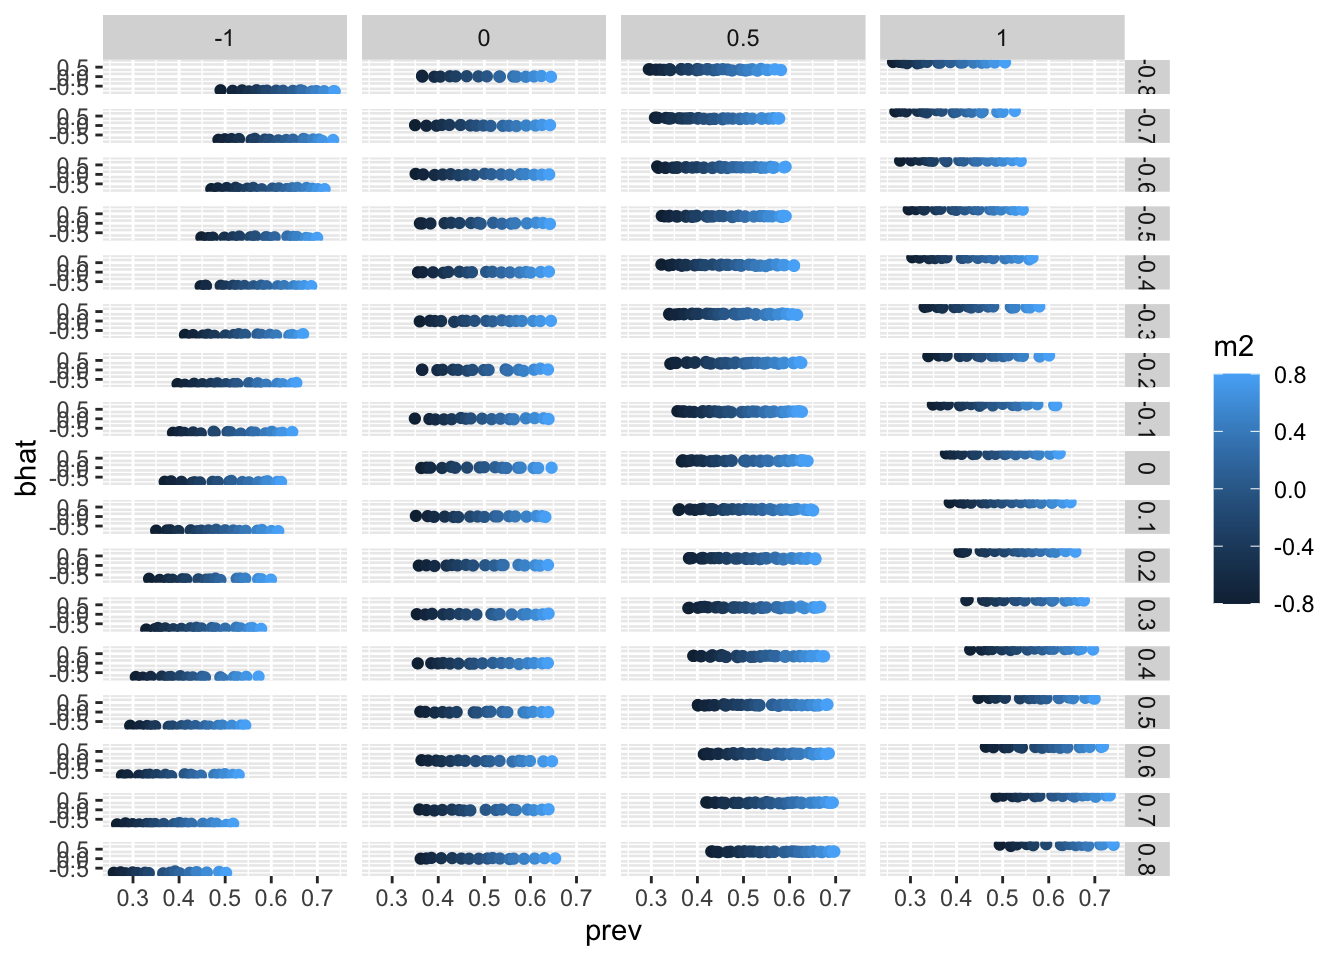
ggplot(p, aes(x=prev, y=bhat)) +
geom_point(aes(colour=m2)) +
facet_grid(m1 ~ b)
summary(lm(bhat ~ m1 + m2, p))
Call:
lm(formula = bhat ~ m1 + m2, data = p)

Residuals:
    Min      1Q  Median      3Q     Max
-0.9782 -0.1597  0.2058  0.2426  0.6615

Coefficients:
             Estimate Std. Error t value Pr(>|t|)
(Intercept)  0.146779   0.013228  11.096   <2e-16 ***
m1          -0.001546   0.027002  -0.057    0.954
m2          -0.001075   0.027002  -0.040    0.968
---
Signif. codes:  0 '***' 0.001 '**' 0.01 '*' 0.05 '.' 0.1 ' ' 1

Residual standard error: 0.5028 on 1442 degrees of freedom
Multiple R-squared:  3.373e-06, Adjusted R-squared:  -0.001384
F-statistic: 0.002432 on 2 and 1442 DF,  p-value: 0.9976
no influence
R version 4.3.0 (2023-04-21)
Platform: aarch64-apple-darwin20 (64-bit)
Running under: macOS Ventura 13.6

Matrix products: default
BLAS:   /Library/Frameworks/R.framework/Versions/4.3-arm64/Resources/lib/libRblas.0.dylib
LAPACK: /Library/Frameworks/R.framework/Versions/4.3-arm64/Resources/lib/libRlapack.dylib;  LAPACK version 3.11.0

locale:
[1] en_GB.UTF-8/en_GB.UTF-8/en_GB.UTF-8/C/en_GB.UTF-8/en_GB.UTF-8

time zone: America/New_York
tzcode source: internal

attached base packages:
[1] stats     graphics  grDevices utils     datasets  methods   base

other attached packages:
[1] ggplot2_3.4.2 dplyr_1.1.2

loaded via a namespace (and not attached):
 [1] vctrs_0.6.3       cli_3.6.1         knitr_1.43        rlang_1.1.1
 [5] xfun_0.39         generics_0.1.3    jsonlite_1.8.7    labeling_0.4.2
 [9] glue_1.6.2        colorspace_2.1-0  htmltools_0.5.5   scales_1.2.1
[13] fansi_1.0.4       rmarkdown_2.22    grid_4.3.0        munsell_0.5.0
[17] evaluate_0.21     tibble_3.2.1      fastmap_1.1.1     yaml_2.3.7
[21] lifecycle_1.0.3   compiler_4.3.0    htmlwidgets_1.6.2 pkgconfig_2.0.3
[25] rstudioapi_0.14   farver_2.1.1      digest_0.6.31     R6_2.5.1
[29] tidyselect_1.2.0  utf8_1.2.3        pillar_1.9.0      magrittr_2.0.3
[33] withr_2.5.0       tools_4.3.0       gtable_0.3.3