Background
- What is the data generating model for the mQTL x celltype interaction analysis?
- Does this rescue the per-celltype mQTL effects?
Basic simulation
- Five cell types
- 10k individuals
- Different SNP effect on methylation in each cell type
- Each individual has a different cell type proportion
- Bulk tissue is the weighted average of all the cell types (weighted by cell type proportion in the individual)
- Can we recapitulate the cell-type specific effect through the interaction term?
Attaching package: 'dplyr'
The following objects are masked from 'package:stats':

    filter, lag
The following objects are masked from 'package:base':

    intersect, setdiff, setequal, union
library(ggplot2)

sim <- function(nc, n)
{
    g <- rbinom(n, 2, 0.4)
    betas <- runif(nc, -2, 2)
    m <- sapply(1:nc, function(i)
    {
        g * betas[i] + rnorm(n)
    })
    # for each individual sample cell type proportions
    cellprop <- sapply(1:n, function(x) {a <- runif(nc); a/sum(a)}) %>% t()
    # weighted sum
    M <- (scale(m) * cellprop) %>% rowSums
    res <- sapply(1:nc, function(i)
    {
      summary(lm(M ~ g * cellprop[,i]))$coef[4,1]
    })
    return(tibble(res, betas))
}

o <- lapply(1:1000, function(i) sim(5, 10000) %>% mutate(sim=i)) %>% bind_rows()
o
# A tibble: 5,000 × 3
       res   betas   sim
     <dbl>   <dbl> <int>
 1 -0.820  -1.59       1
 2  0.358  -0.0905     1
 3  0.0370 -0.481      1
 4 -0.841  -1.62       1
 5  1.24    0.459      1
 6  1.70    1.34       2
 7 -0.870  -1.35       2
 8 -0.902  -1.39       2
 9  0.942   0.500      2
10 -0.788  -1.45       2
# … with 4,990 more rows
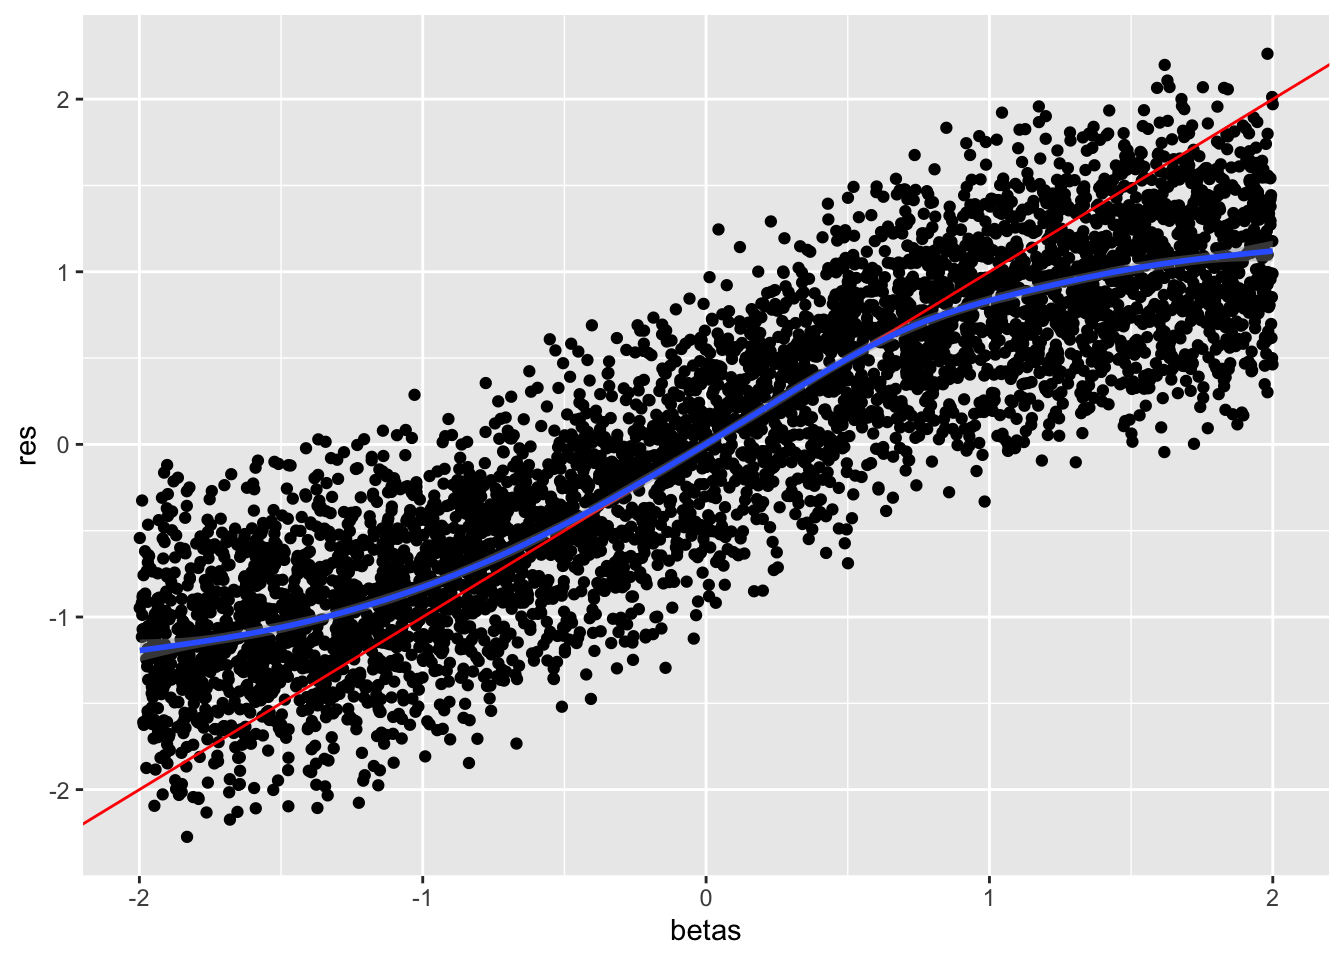
ggplot(o, aes(x=betas, y=res)) +
geom_point() +
geom_abline(colour="red") +
geom_smooth()
`geom_smooth()` using method = 'gam' and formula = 'y ~ s(x, bs = "cs")'
Generally seems to work but expect some shrinkage of large effects
Introduce measurement error in cell-type proportions
cellprop_noise <- function(cellprop, sigma)
{
    apply(cellprop, 1, function(x)
    {
        a <- rnorm(length(x), x, sigma)
        a / sum(a)
    }) %>% t()
}
sim2 <- function(nc, n, noise_sigma)
{
    g <- rbinom(n, 2, 0.4)
    betas <- runif(nc, -2, 2)
    m <- sapply(1:nc, function(i)
    {
        g * betas[i] + rnorm(n)
    })
    # for each individual sample cell type proportions
    cellprop <- sapply(1:n, function(x) {a <- runif(nc); a/sum(a)}) %>% t()
    cpn <- cellprop_noise(cellprop, noise_sigma)
    # weighted sum
    M <- (scale(m) * cellprop) %>% rowSums
    res <- sapply(1:nc, function(i)
    {
      summary(lm(M ~ g * cpn[,i]))$coef[4,1]
    })
    return(tibble(res, betas))
}

o2 <- lapply(1:1000, function(i) {
    s <- sample(c(0, 0.05, 0.1), 1)
    sim2(5, 10000, s) %>% mutate(sim=i, s=s)
}) %>% bind_rows()
o2
# A tibble: 5,000 × 4
        res  betas   sim     s
      <dbl>  <dbl> <int> <dbl>
 1  1.32     0.524     1  0.05
 2 -0.106   -0.890     1  0.05
 3 -0.231   -0.982     1  0.05
 4 -0.480   -1.77      1  0.05
 5 -0.482   -1.48      1  0.05
 6  0.102    0.141     2  0.05
 7 -0.00435  0.107     2  0.05
 8 -0.738   -0.825     2  0.05
 9 -0.160   -0.188     2  0.05
10  0.787    0.834     2  0.05
# … with 4,990 more rows
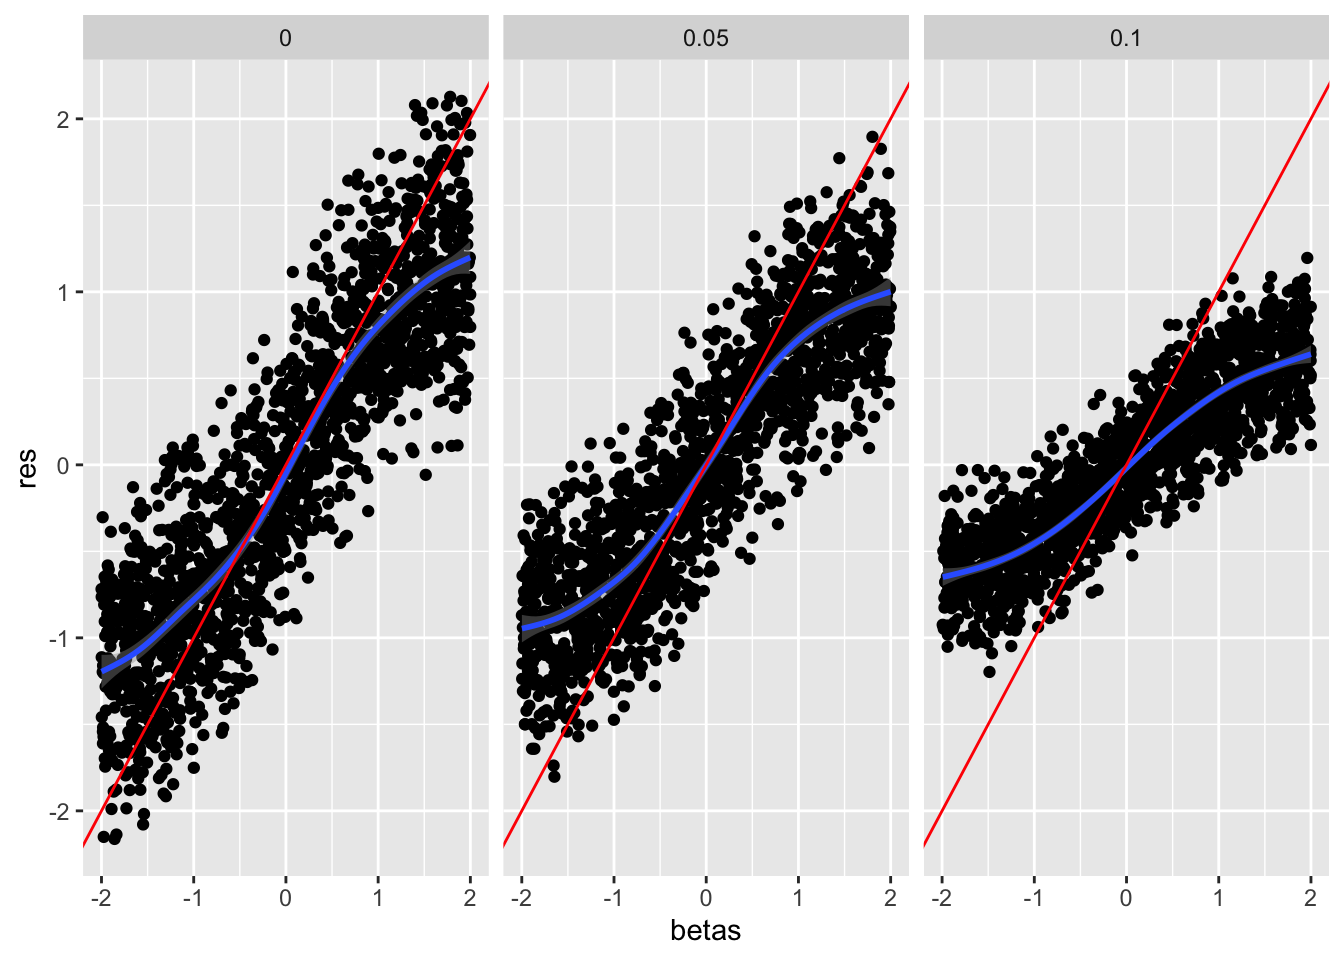
ggplot(o2, aes(x=betas, y=res)) +
geom_point() +
geom_smooth() +
geom_abline(colour="red") +
facet_wrap(~ s)
`geom_smooth()` using method = 'gam' and formula = 'y ~ s(x, bs = "cs")'
Noisy estimates of cell type proportions will lead to attenuated effect estimates
R version 4.2.1 Patched (2022-09-06 r82817)
Platform: aarch64-apple-darwin20 (64-bit)
Running under: macOS Monterey 12.6.2

Matrix products: default
BLAS:   /Library/Frameworks/R.framework/Versions/4.2-arm64/Resources/lib/libRblas.0.dylib
LAPACK: /Library/Frameworks/R.framework/Versions/4.2-arm64/Resources/lib/libRlapack.dylib

locale:
[1] en_GB.UTF-8/en_GB.UTF-8/en_GB.UTF-8/C/en_GB.UTF-8/en_GB.UTF-8

attached base packages:
[1] stats     graphics  grDevices utils     datasets  methods   base

other attached packages:
[1] ggplot2_3.4.0 dplyr_1.0.10

loaded via a namespace (and not attached):
 [1] pillar_1.8.1      compiler_4.2.1    tools_4.2.1       digest_0.6.31
 [5] jsonlite_1.8.4    evaluate_0.19     lifecycle_1.0.3   tibble_3.1.8
 [9] gtable_0.3.1      nlme_3.1-158      lattice_0.20-45   mgcv_1.8-40
[13] pkgconfig_2.0.3   rlang_1.0.6       Matrix_1.4-1      DBI_1.1.3
[17] cli_3.5.0         yaml_2.3.6        xfun_0.36         fastmap_1.1.0
[21] withr_2.5.0       stringr_1.5.0     knitr_1.41        generics_0.1.3
[25] vctrs_0.5.1       htmlwidgets_1.5.4 grid_4.2.1        tidyselect_1.2.0
[29] glue_1.6.2        R6_2.5.1          fansi_1.0.3       rmarkdown_2.16
[33] farver_2.1.1      magrittr_2.0.3    scales_1.2.1      htmltools_0.5.4
[37] splines_4.2.1     assertthat_0.2.1  colorspace_2.0-3  labeling_0.4.2
[41] utf8_1.2.2        stringi_1.7.8     munsell_0.5.0